Exploring and understanding WombatOAM
"I have installed WombatOAM, now what?"
This chapter gives you a walkthrough of WombatOAM, demonstrating some of the issues you might encounter in your Erlang and Elixir based systems. It highlights how WombatOAM provides full visibility of what is happening, helping you with pre-emptive support in order to avoid outages, and also with post-mortem debugging to quickly and efficiently find and fix problems, ensuring they do not happen again. Besides, WombatOAM is handy for troubleshooting, online diagnosing and resolving problems and incidents on the fly. This walkthrough should take you about 30 minutes, and is recommended for anyone evaluating or trying to get the most out of WombatOAM.
Basics
To get started, go to the WombatOAM dashboard and click Topology. Click on the + button in the bottom right corner and enter a node name and cookie.
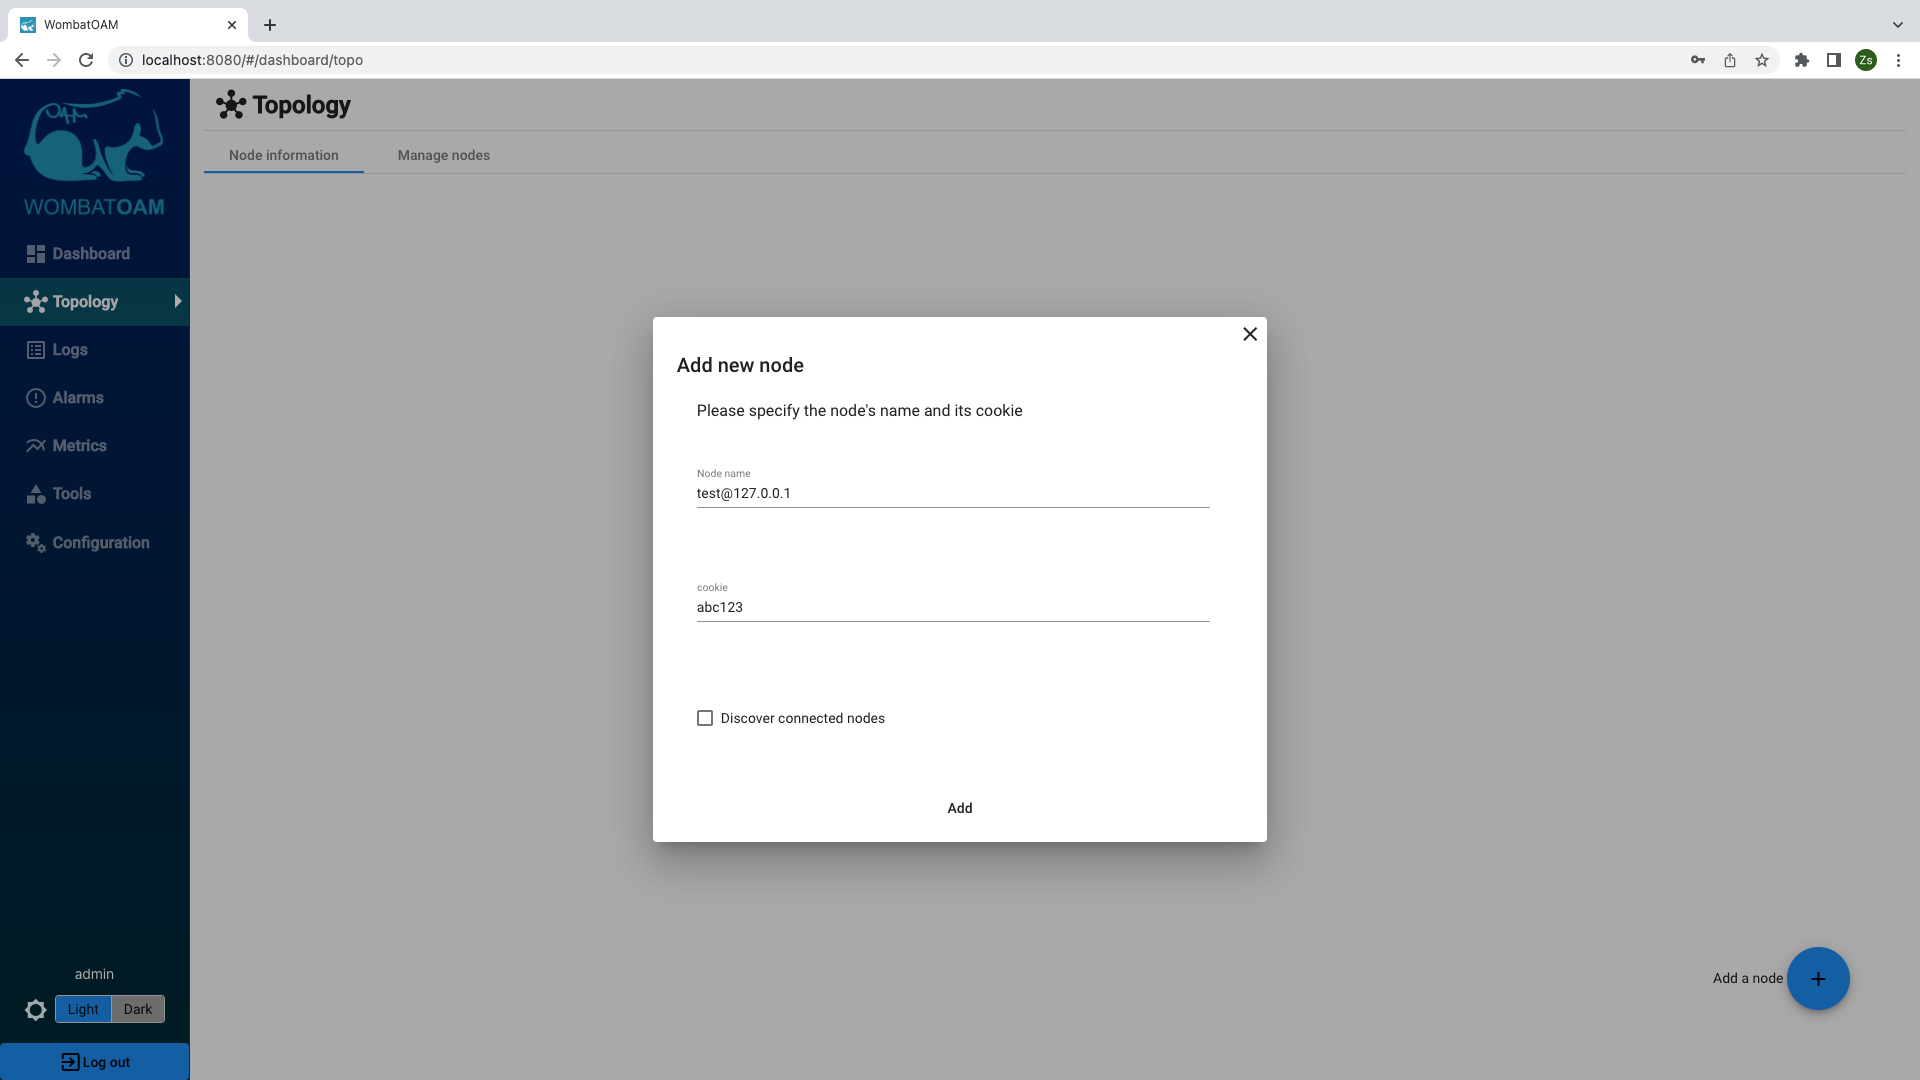
If you are using distributed Erlang in your cluster, select Discover connected nodes to easily add nodes meshed with the one you are adding, to save you the effort of doing it later.
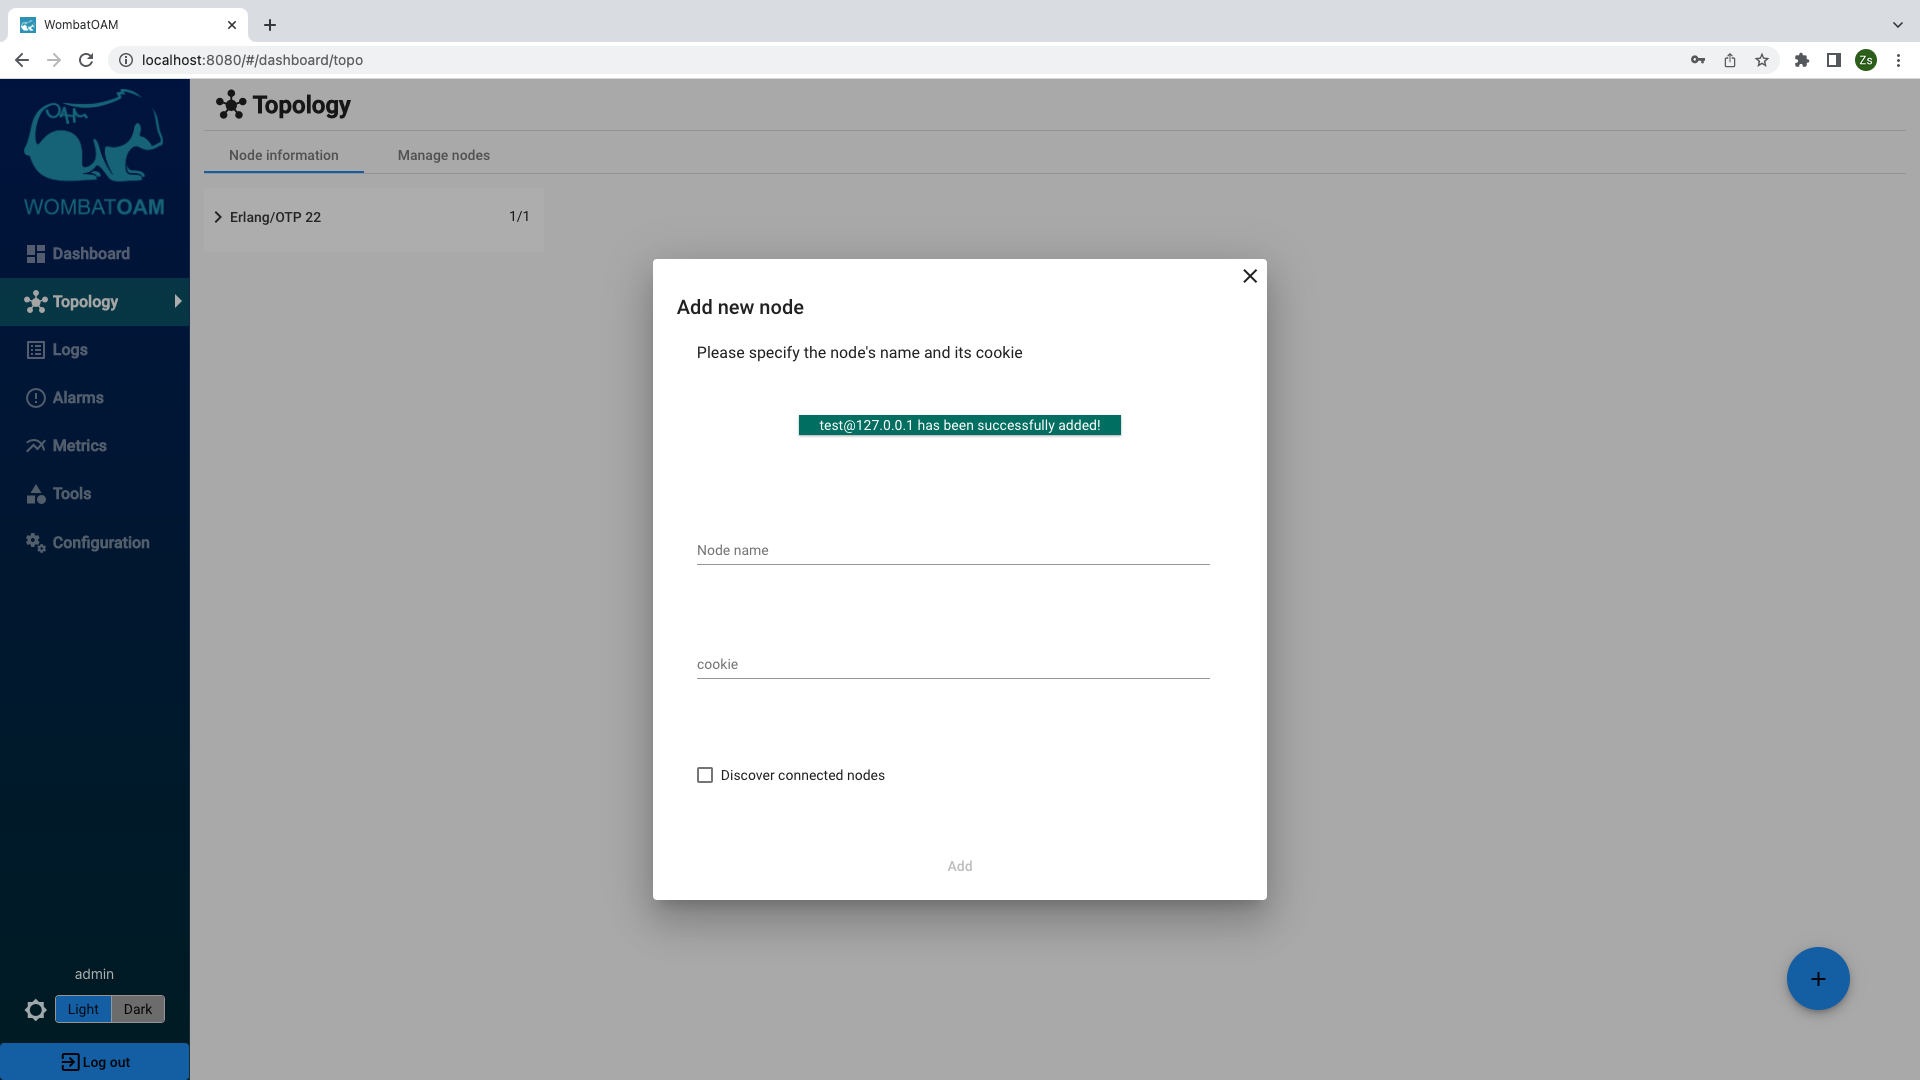
When you have entered the node name and cookie, click the Add node button. This will connect WombatOAM to your cluster, and allow it to start monitoring the nodes.
If you are using multiple cookies, add a node from each cluster using the specific cookie. Note that WombatOAM allows you to connect to nodes with long and short names.
During this walkthrough, you will experiment and simulate a few system issues. If you are connected to a production system and are worried about the impact of this, you can also start and connect to a standalone node. To do this, enter the following command:
erl -sname test -setcookie abc123
Once you have started the node, add it to WombatOAM (the node name is "test" and the cookie is "abc123"). Ensure that you remain connected to the node in the shell. If you need to stop and restart the node later, you can use the same command provided above.
Depending on what applications you are running, WombatOAM will start agents that collect metrics, alarms, logs, other important information about your nodes and also provide tools. Tools are not metrics, logs or alarms, but aid devops with their daily tasks. Have a look at what these agents do, as you can easily write your own plugins introducing new agents.
Select the node to see information about the system, the node and the agents that are running.
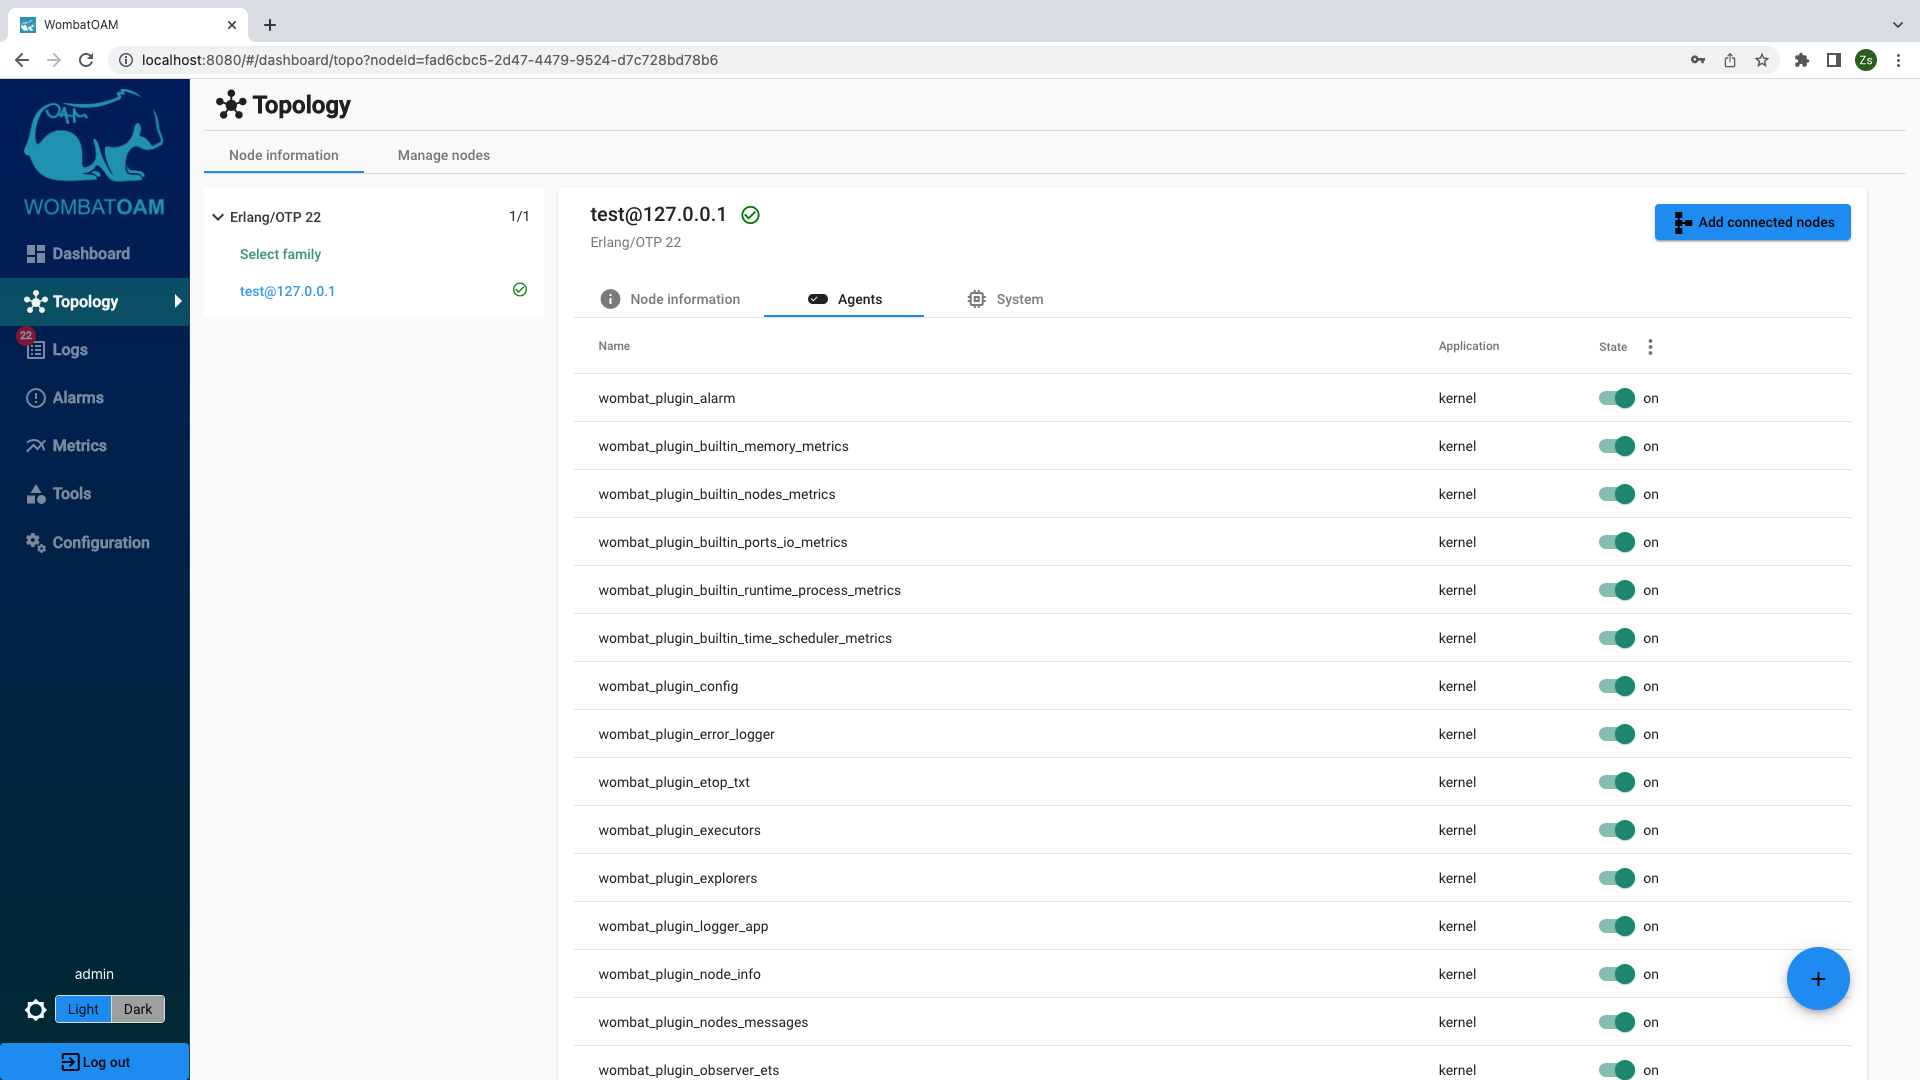
The agents that come with WombatOAM do the work of collecting and generating metrics, notifications and alarms. Also, they enable retrieving live information about running systems (such as the state of a gen_server), recover from outages for instance by forcing the GC to free up memory, or fix misconfiguration issues by changing configuration parameters. A basic installation (excluding the application-specific agents listed below) will include:
- More than 100 metrics and the automatic collection of Exometer and Folsom metrics
- Automatic collection of Lager and SASL logs
- Over 25 built-in alarms and automatic collection of elarm and SASL alarms
- Configuration management
- Etop-like process listing
- ETS table viewer
- Various process inspectors
- Executor for user commands and other actions such as initiating garbage collection
We currently have agents supporting the following applications:
|
|
Explore some more by clicking the Topology menu item. Here you can view comprehensive node and system information.
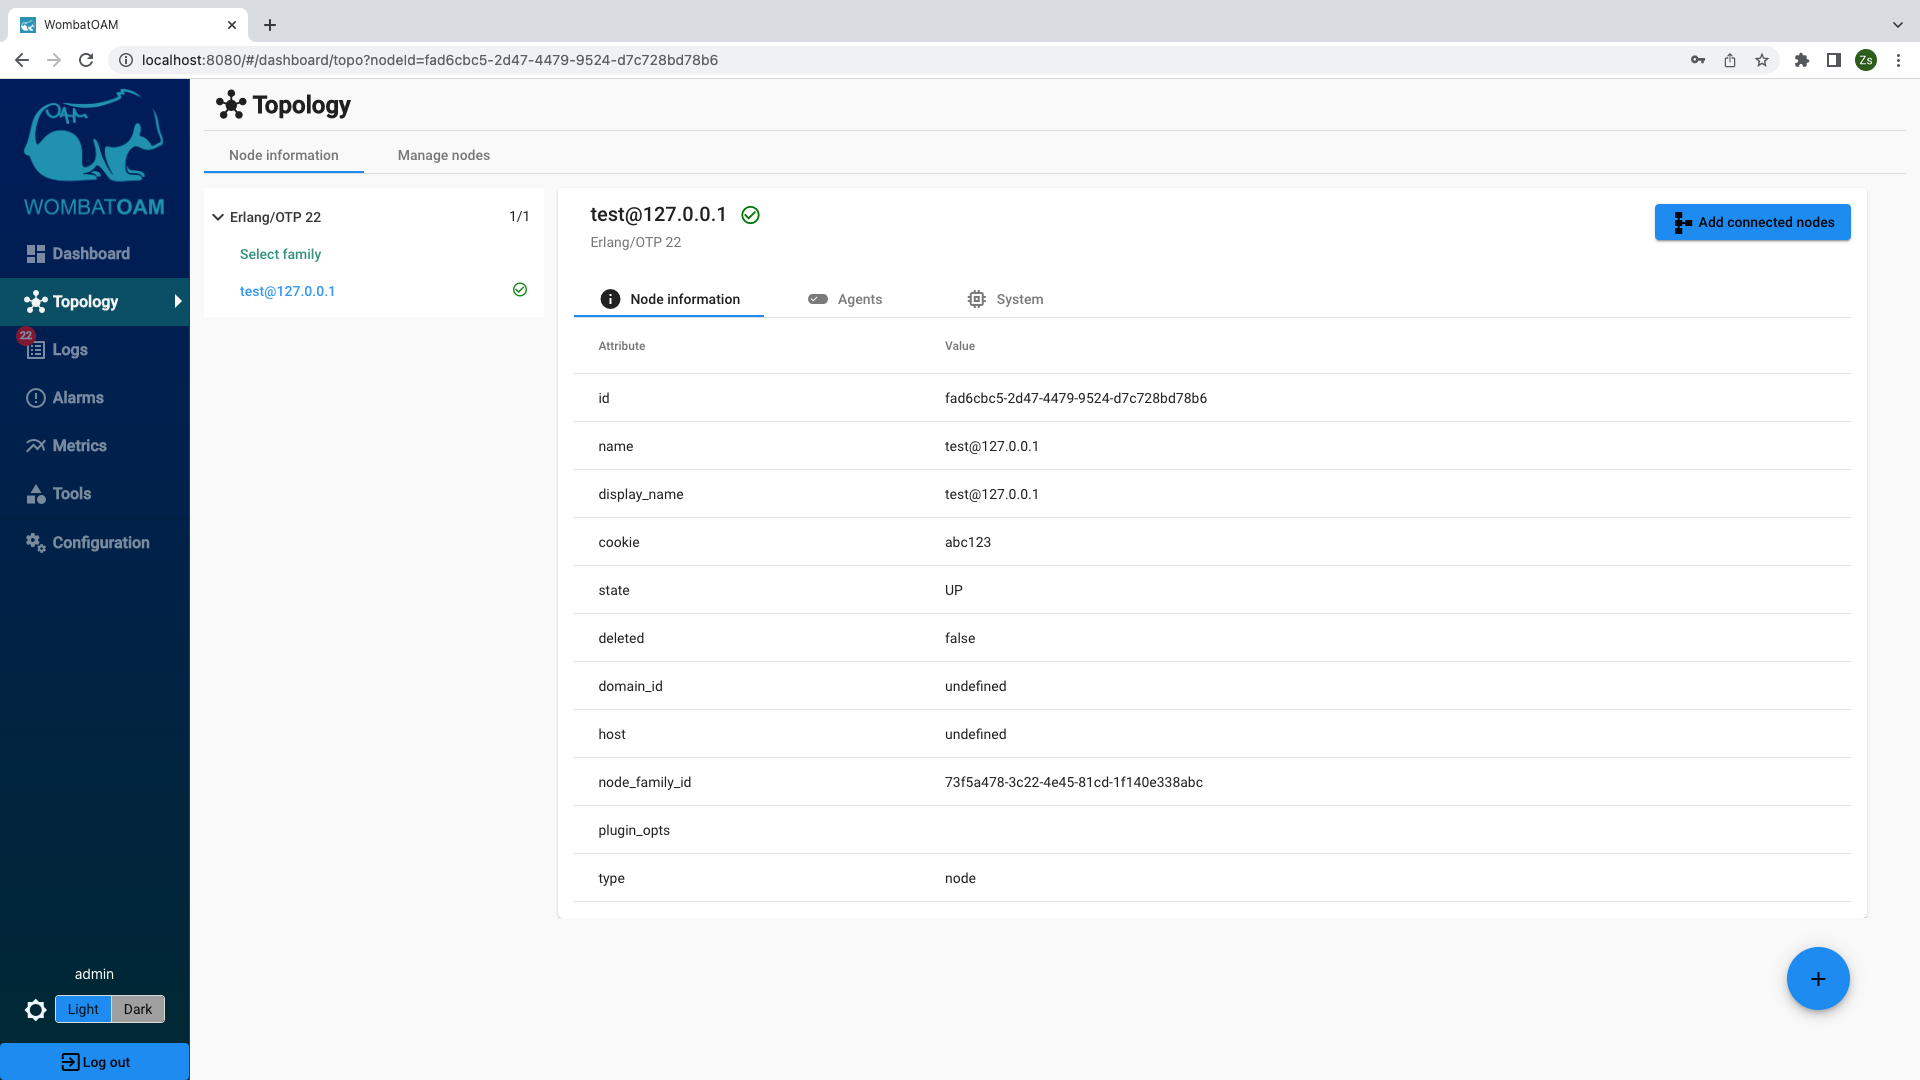
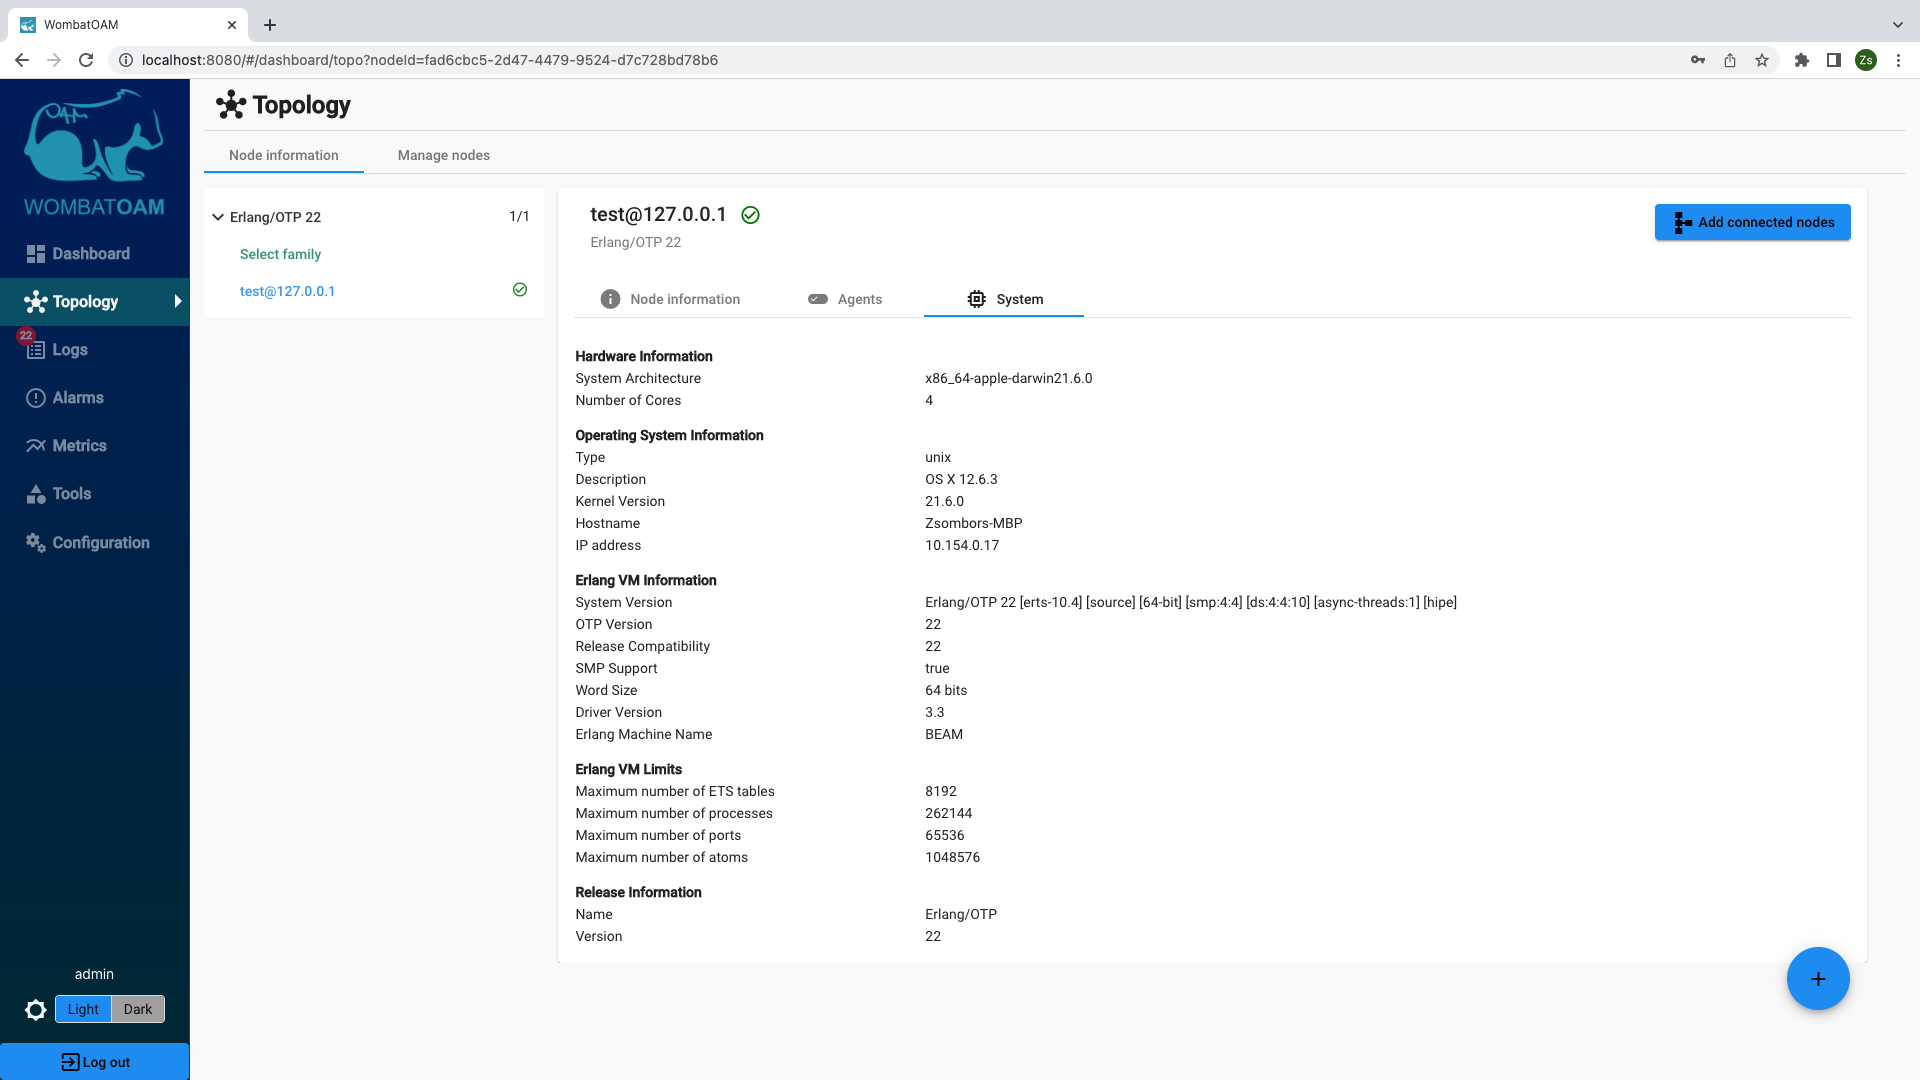
This information can be useful for troubleshooting your system. For example you can check which release is currently used by the node.
To see how WombatOAM monitors your systems, let's use the shell to simulate problems that might occur. If you have a node in your system that you can allow to crash, connect to it. Otherwise, use a standalone test node.
If you have started a separate node, add it to WombatOAM. Ensure that you are connected to the node in the shell, then enter the following command:
1 2 | |
This will associate value with sample_key in the shell process's local store
called the "Process Dictionary" and then send 100,000 messages to the shell
process, simulating producers sending requests at a faster rate than the
consumers can handle. Long message queues are often a symptom of a bottleneck
and result in the degradation of throughput, with the system eventually running
out of memory.
First, retrieve live information about your running processes. In WombatOAM, go to Tools. Select your test node and then open the Process Manager panel.
Notice that the shell process has the largest message queue.
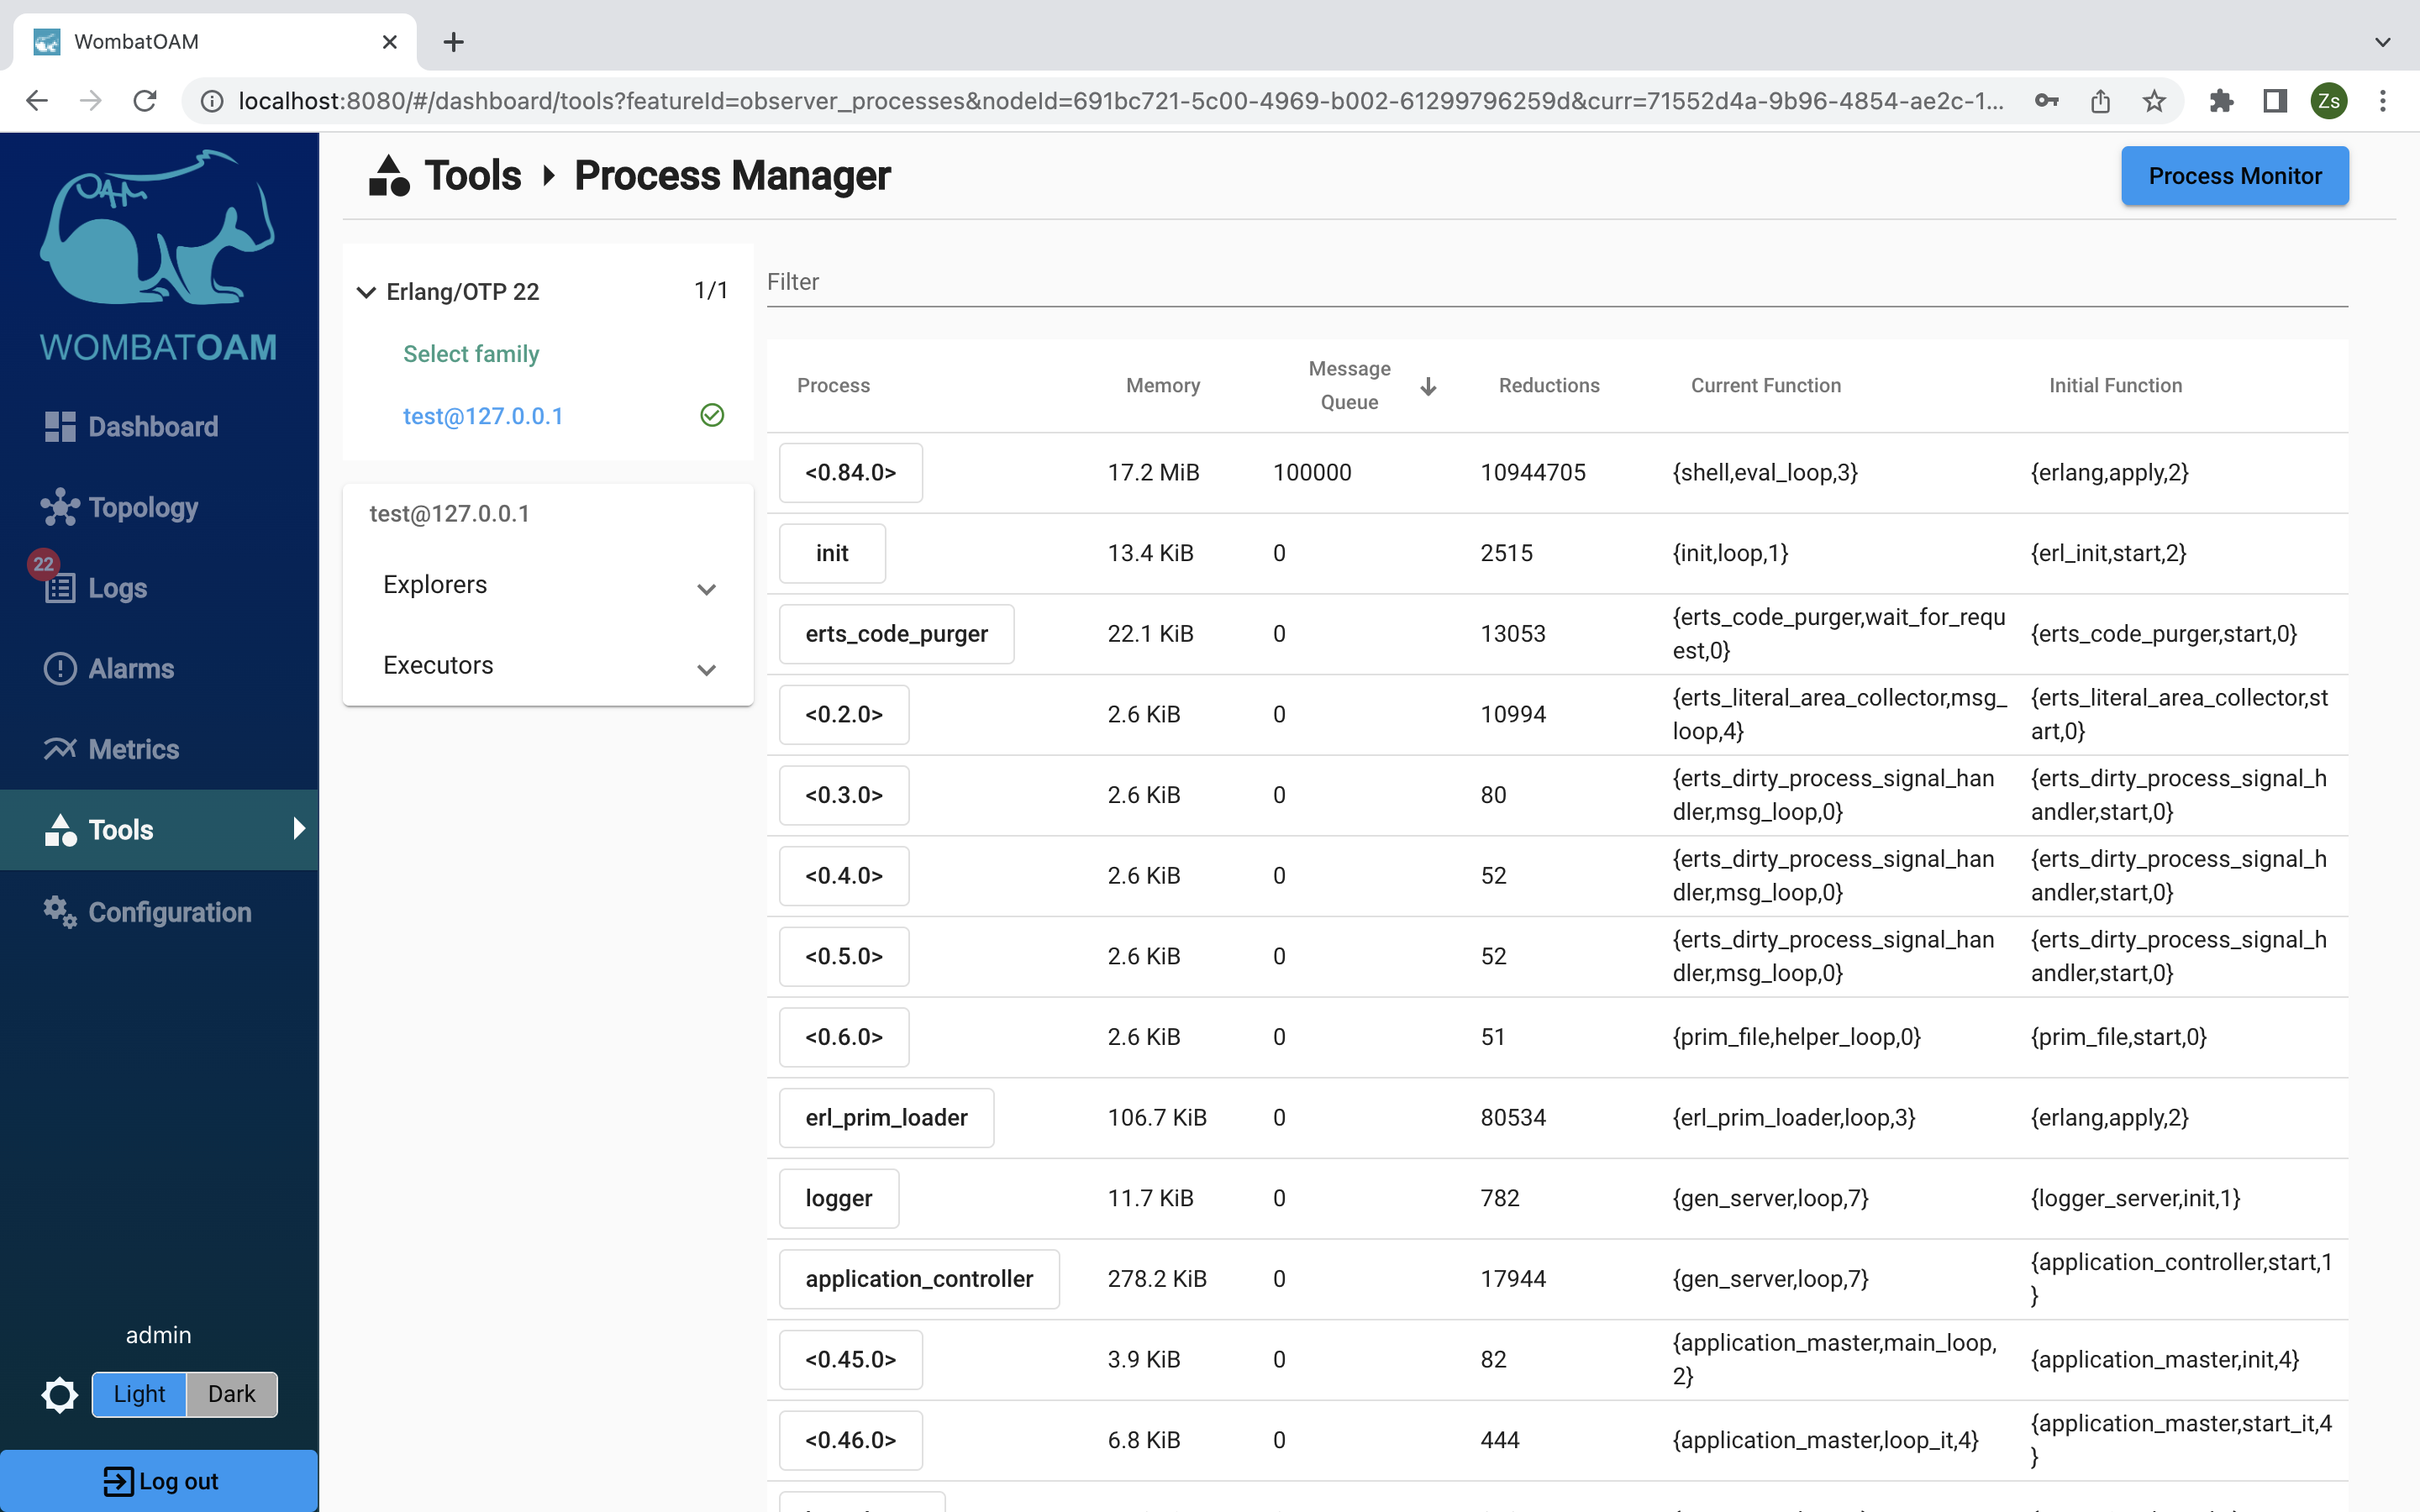
By clicking on the Pid of the shell process, various information, such as process info, process messages, process dictionary, process state, process stack trace) can be retrieved about this process. These come in handy when your system doesn't behave as expected and you want to find the root cause.
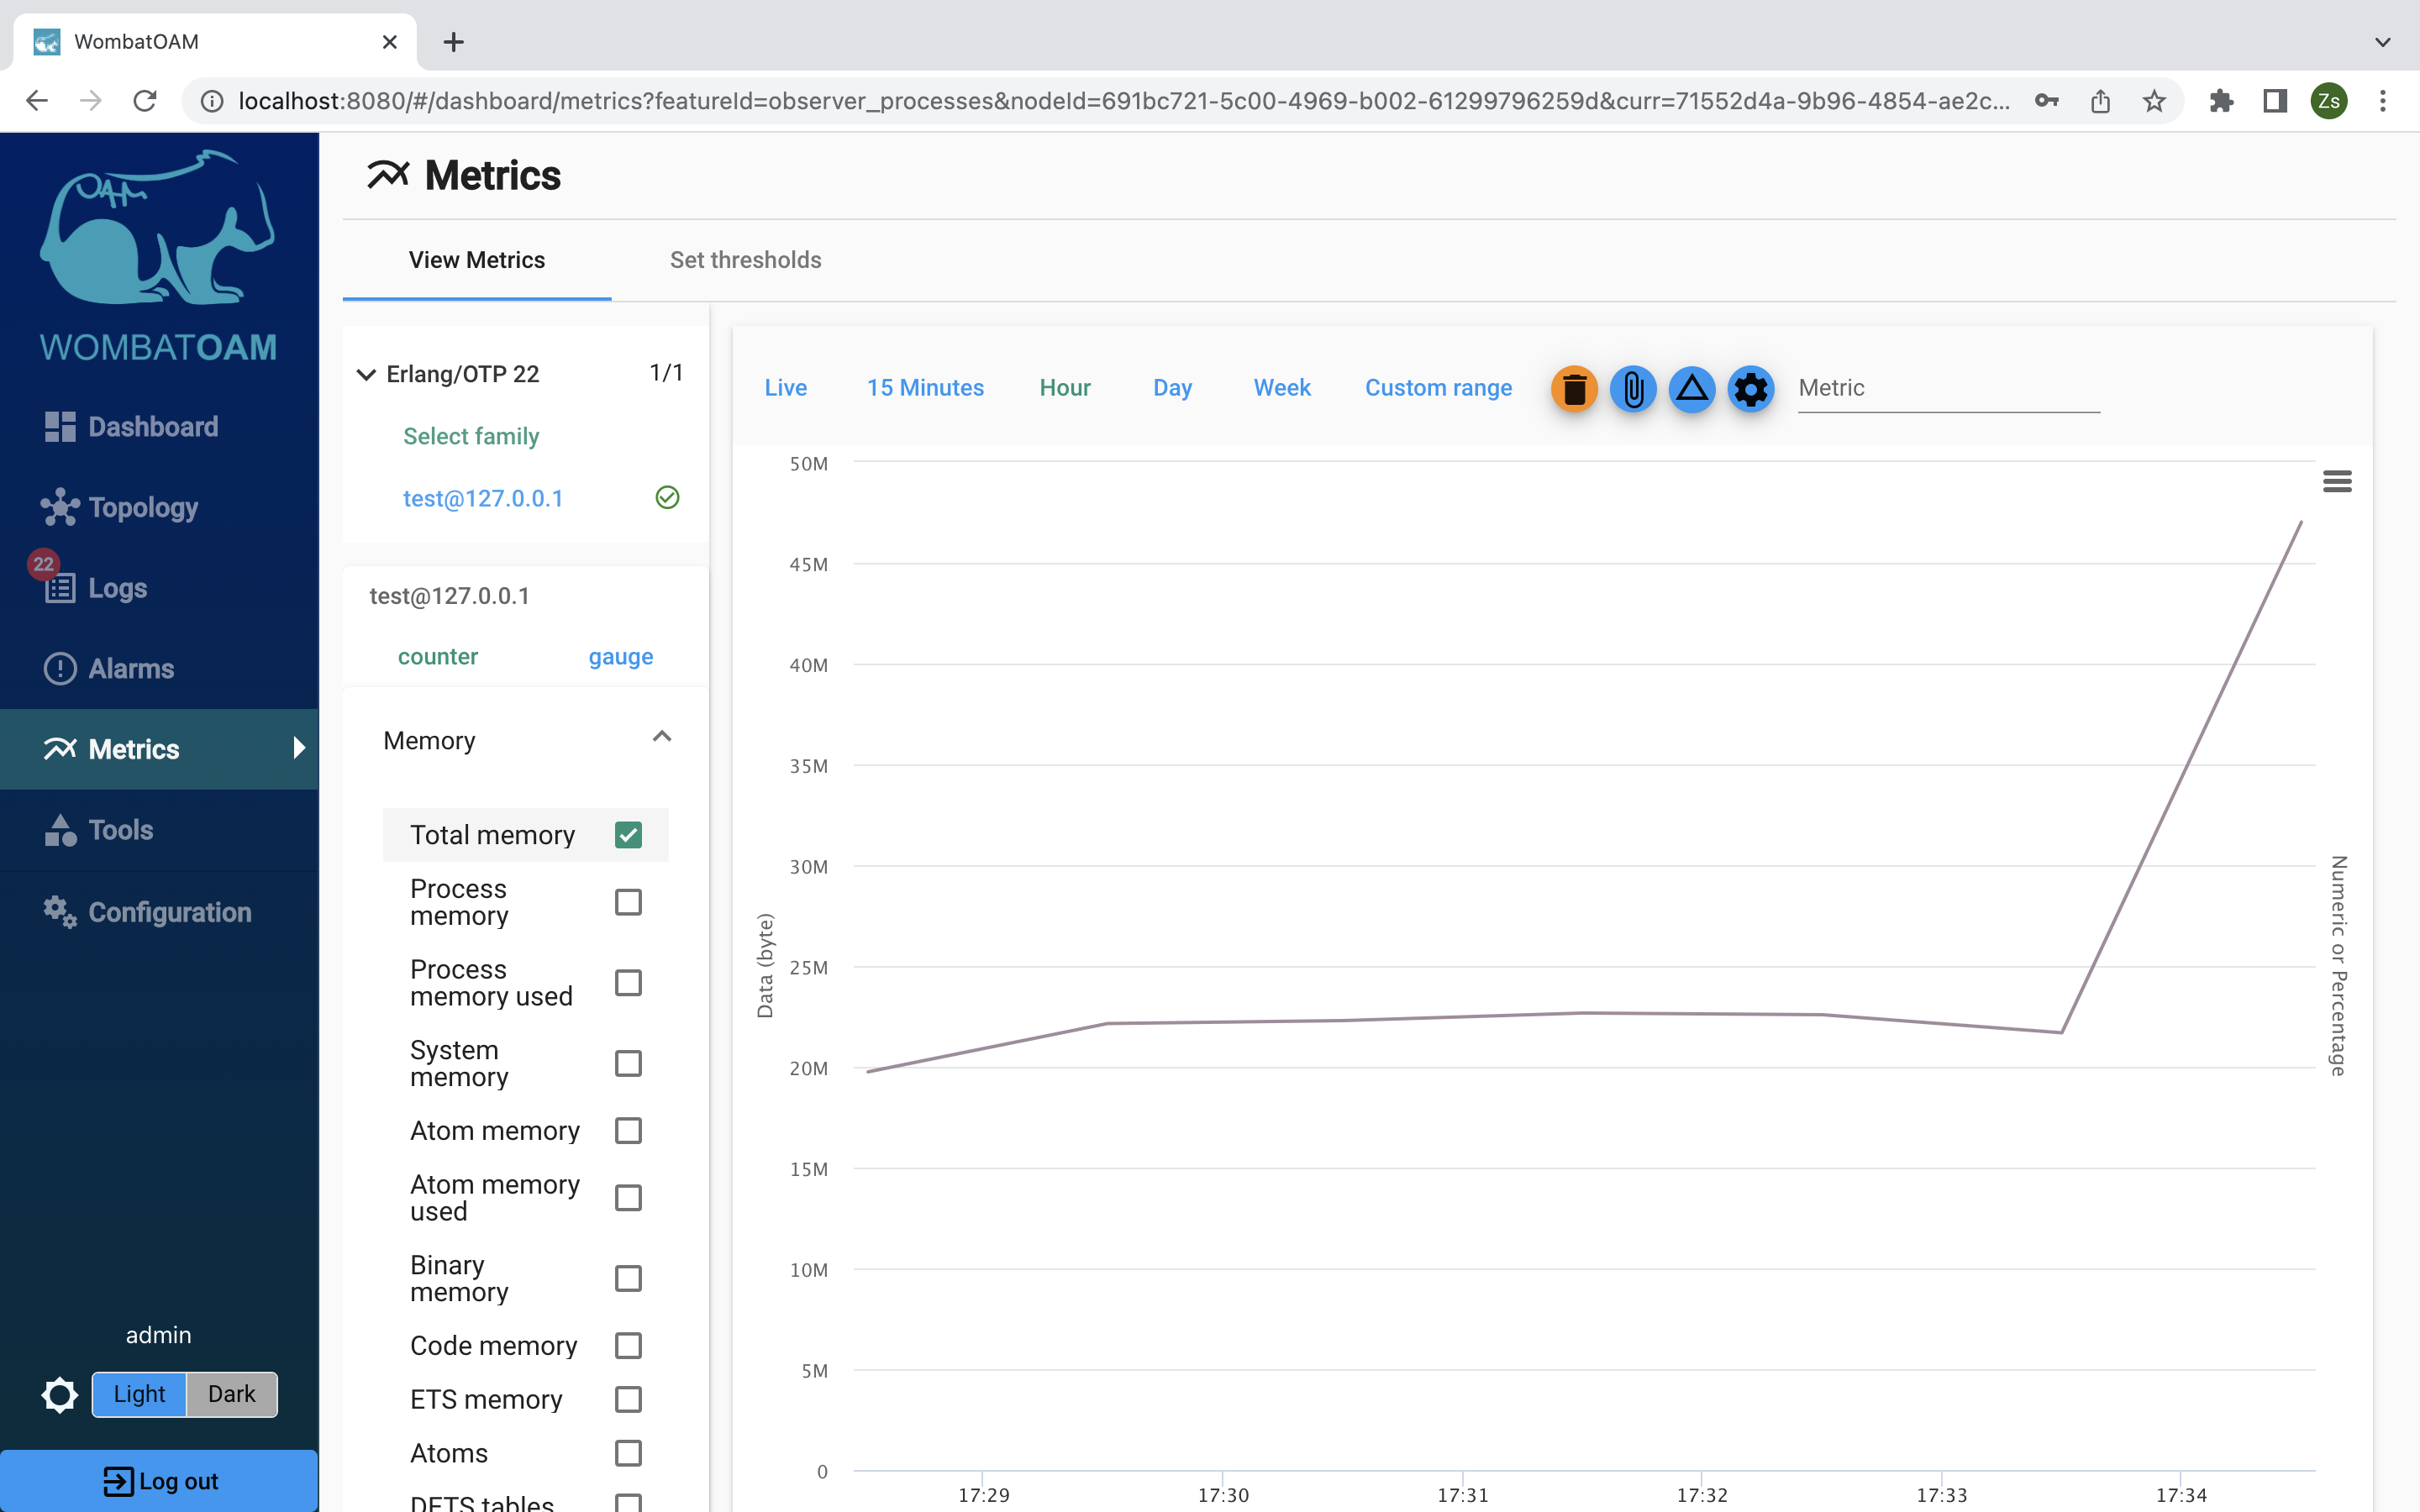
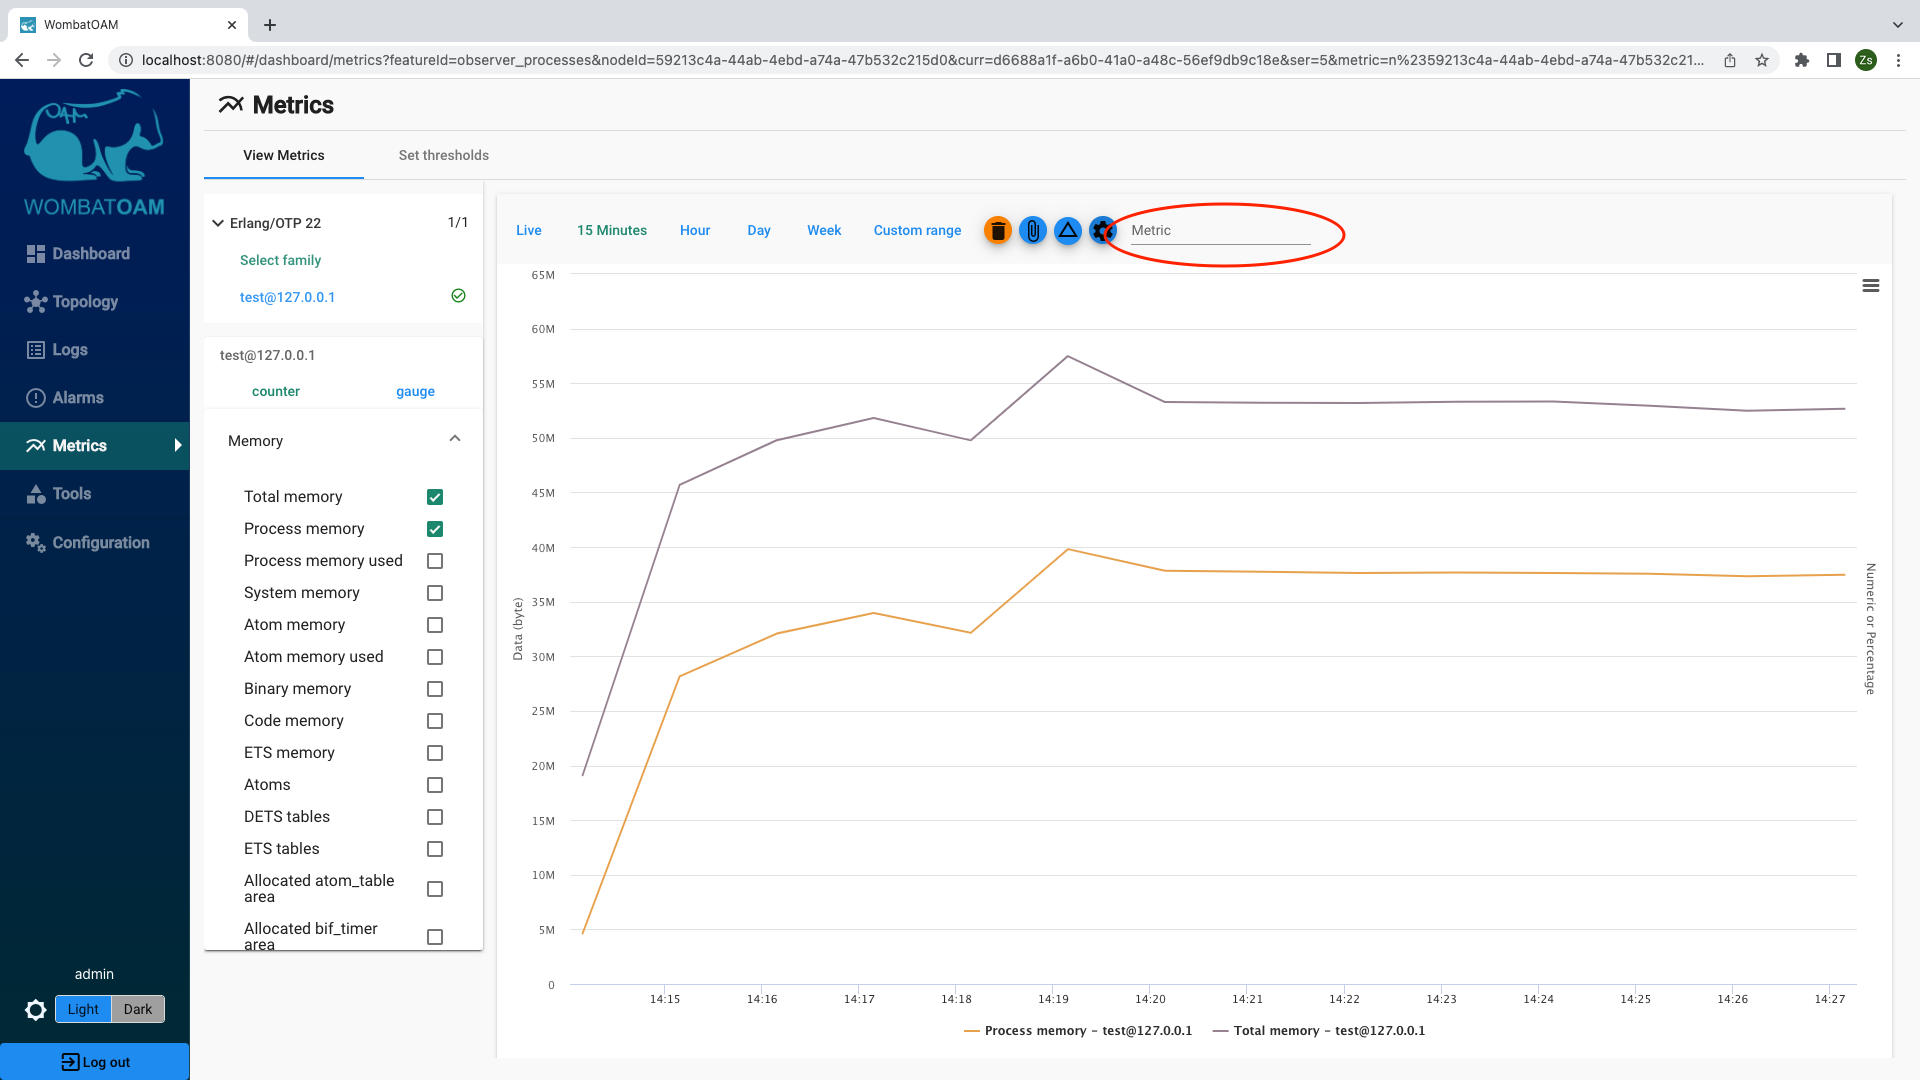
Next, go to Metrics, select the node to which you issued the command, on the gauge tab, select Memory, and then select Total memory to view that metric as a graph. (Note that metrics are collected once a minute, so you may have to wait briefly for the graph to update.)
Notice how sending the messages affected the total memory increase.
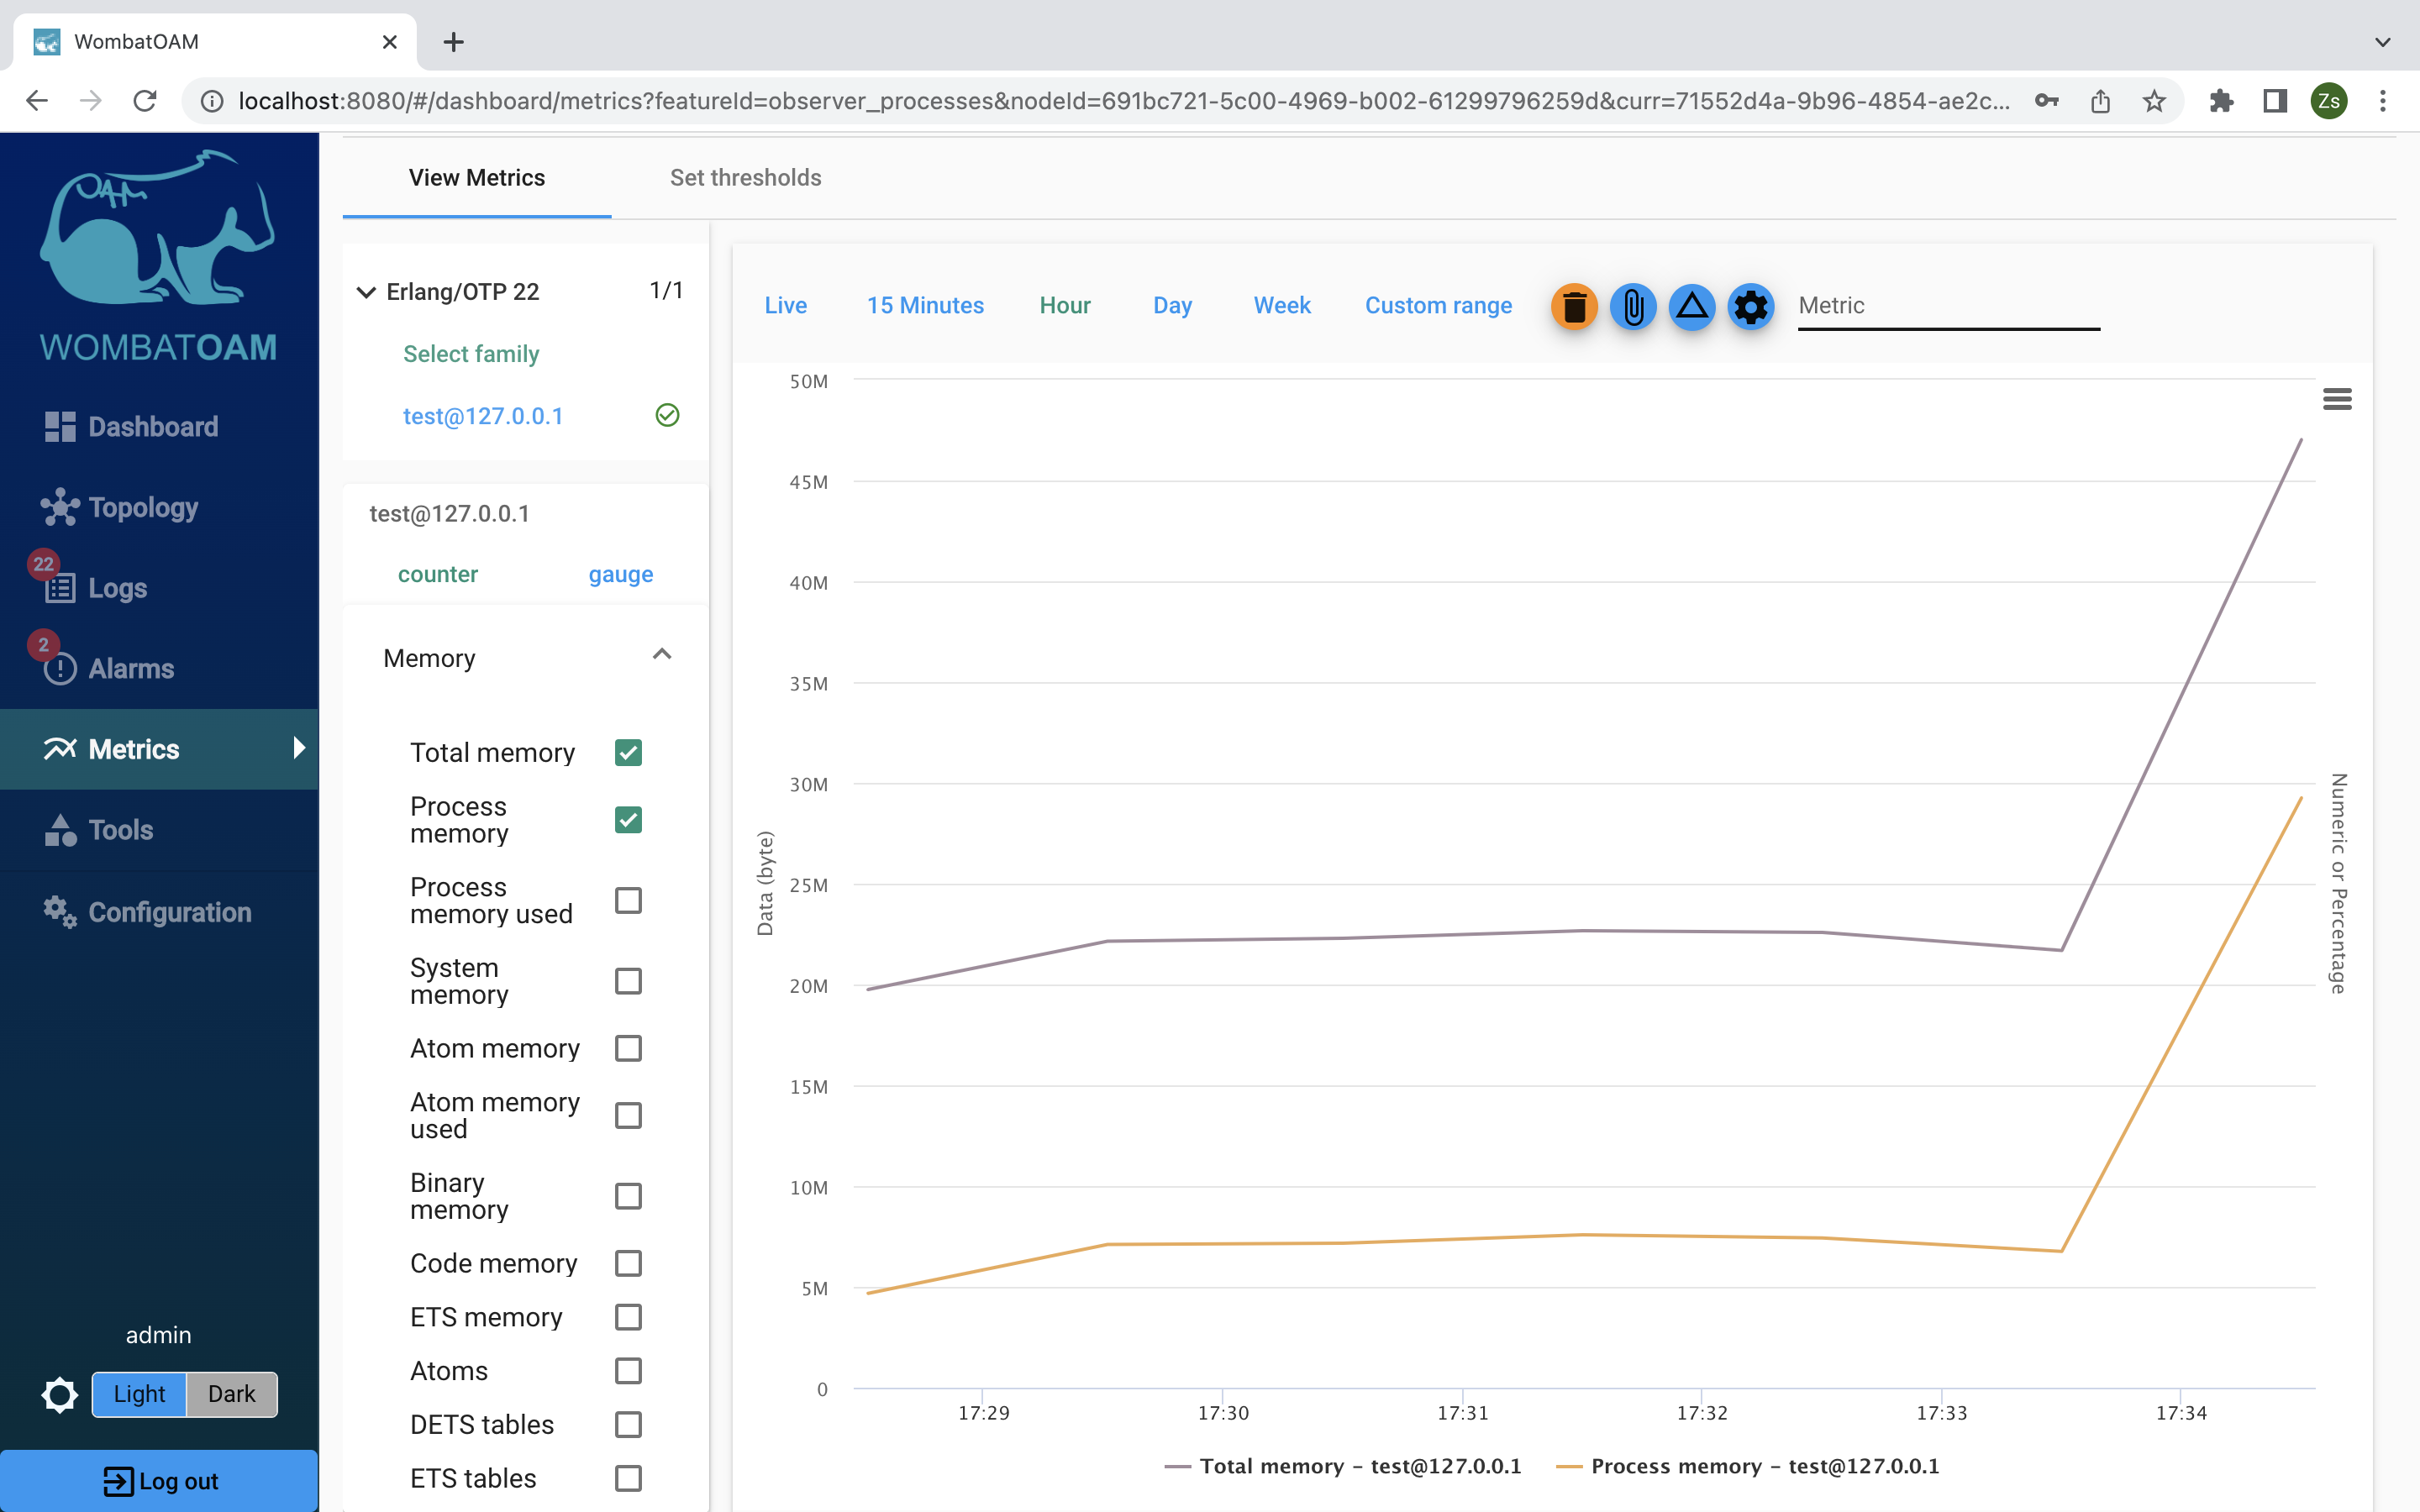
Select Process memory used to see how process memory affected the total memory.
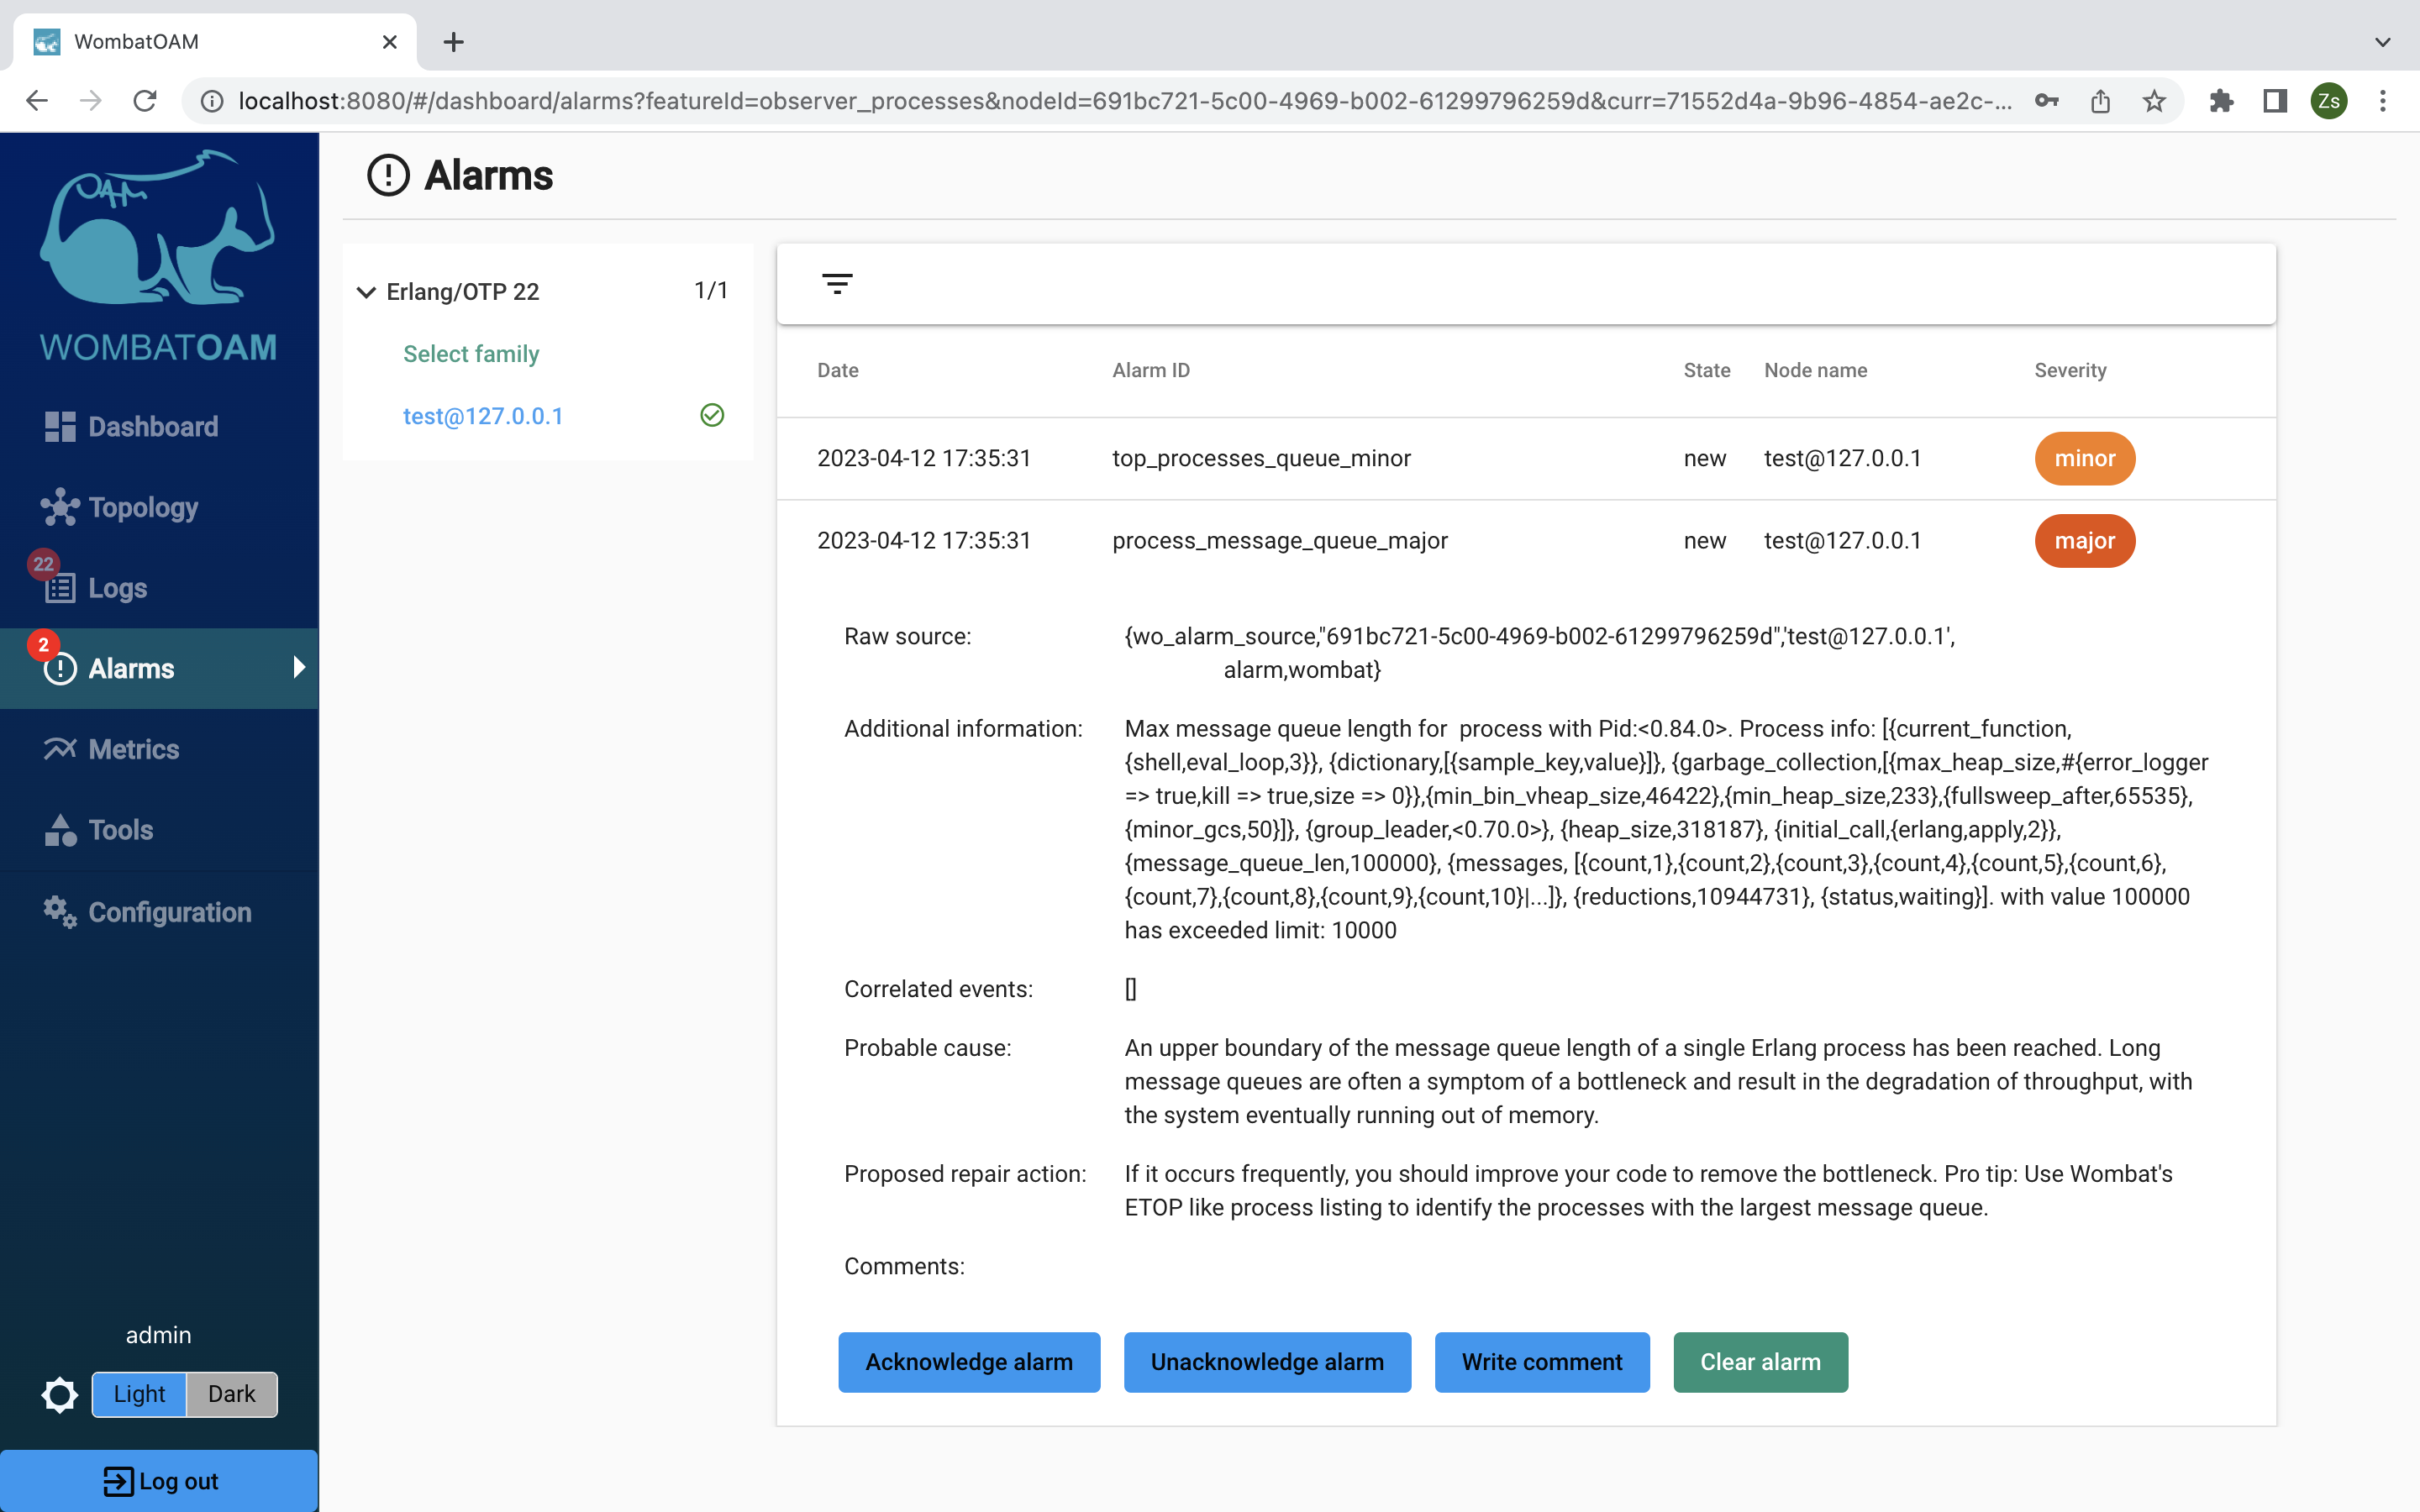
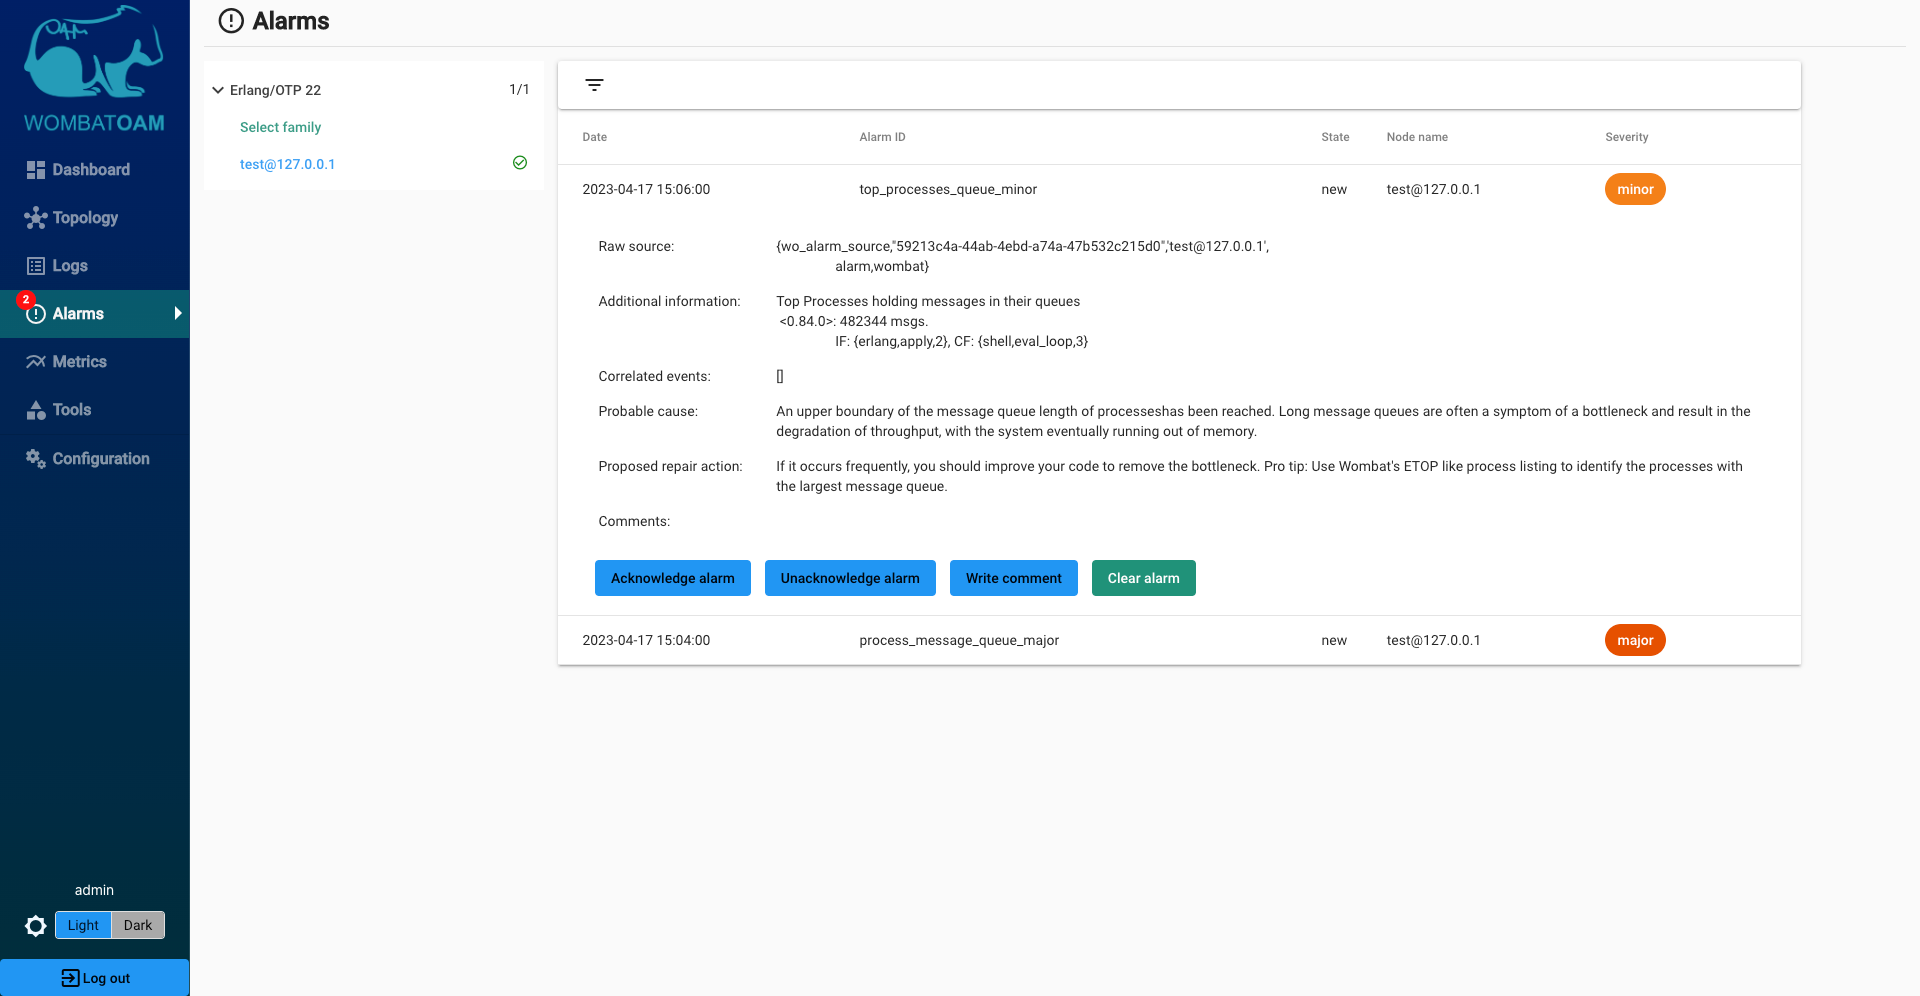
Select the Alarms tab. Note the new process_message_queue_major alarm with severity major that will appear.
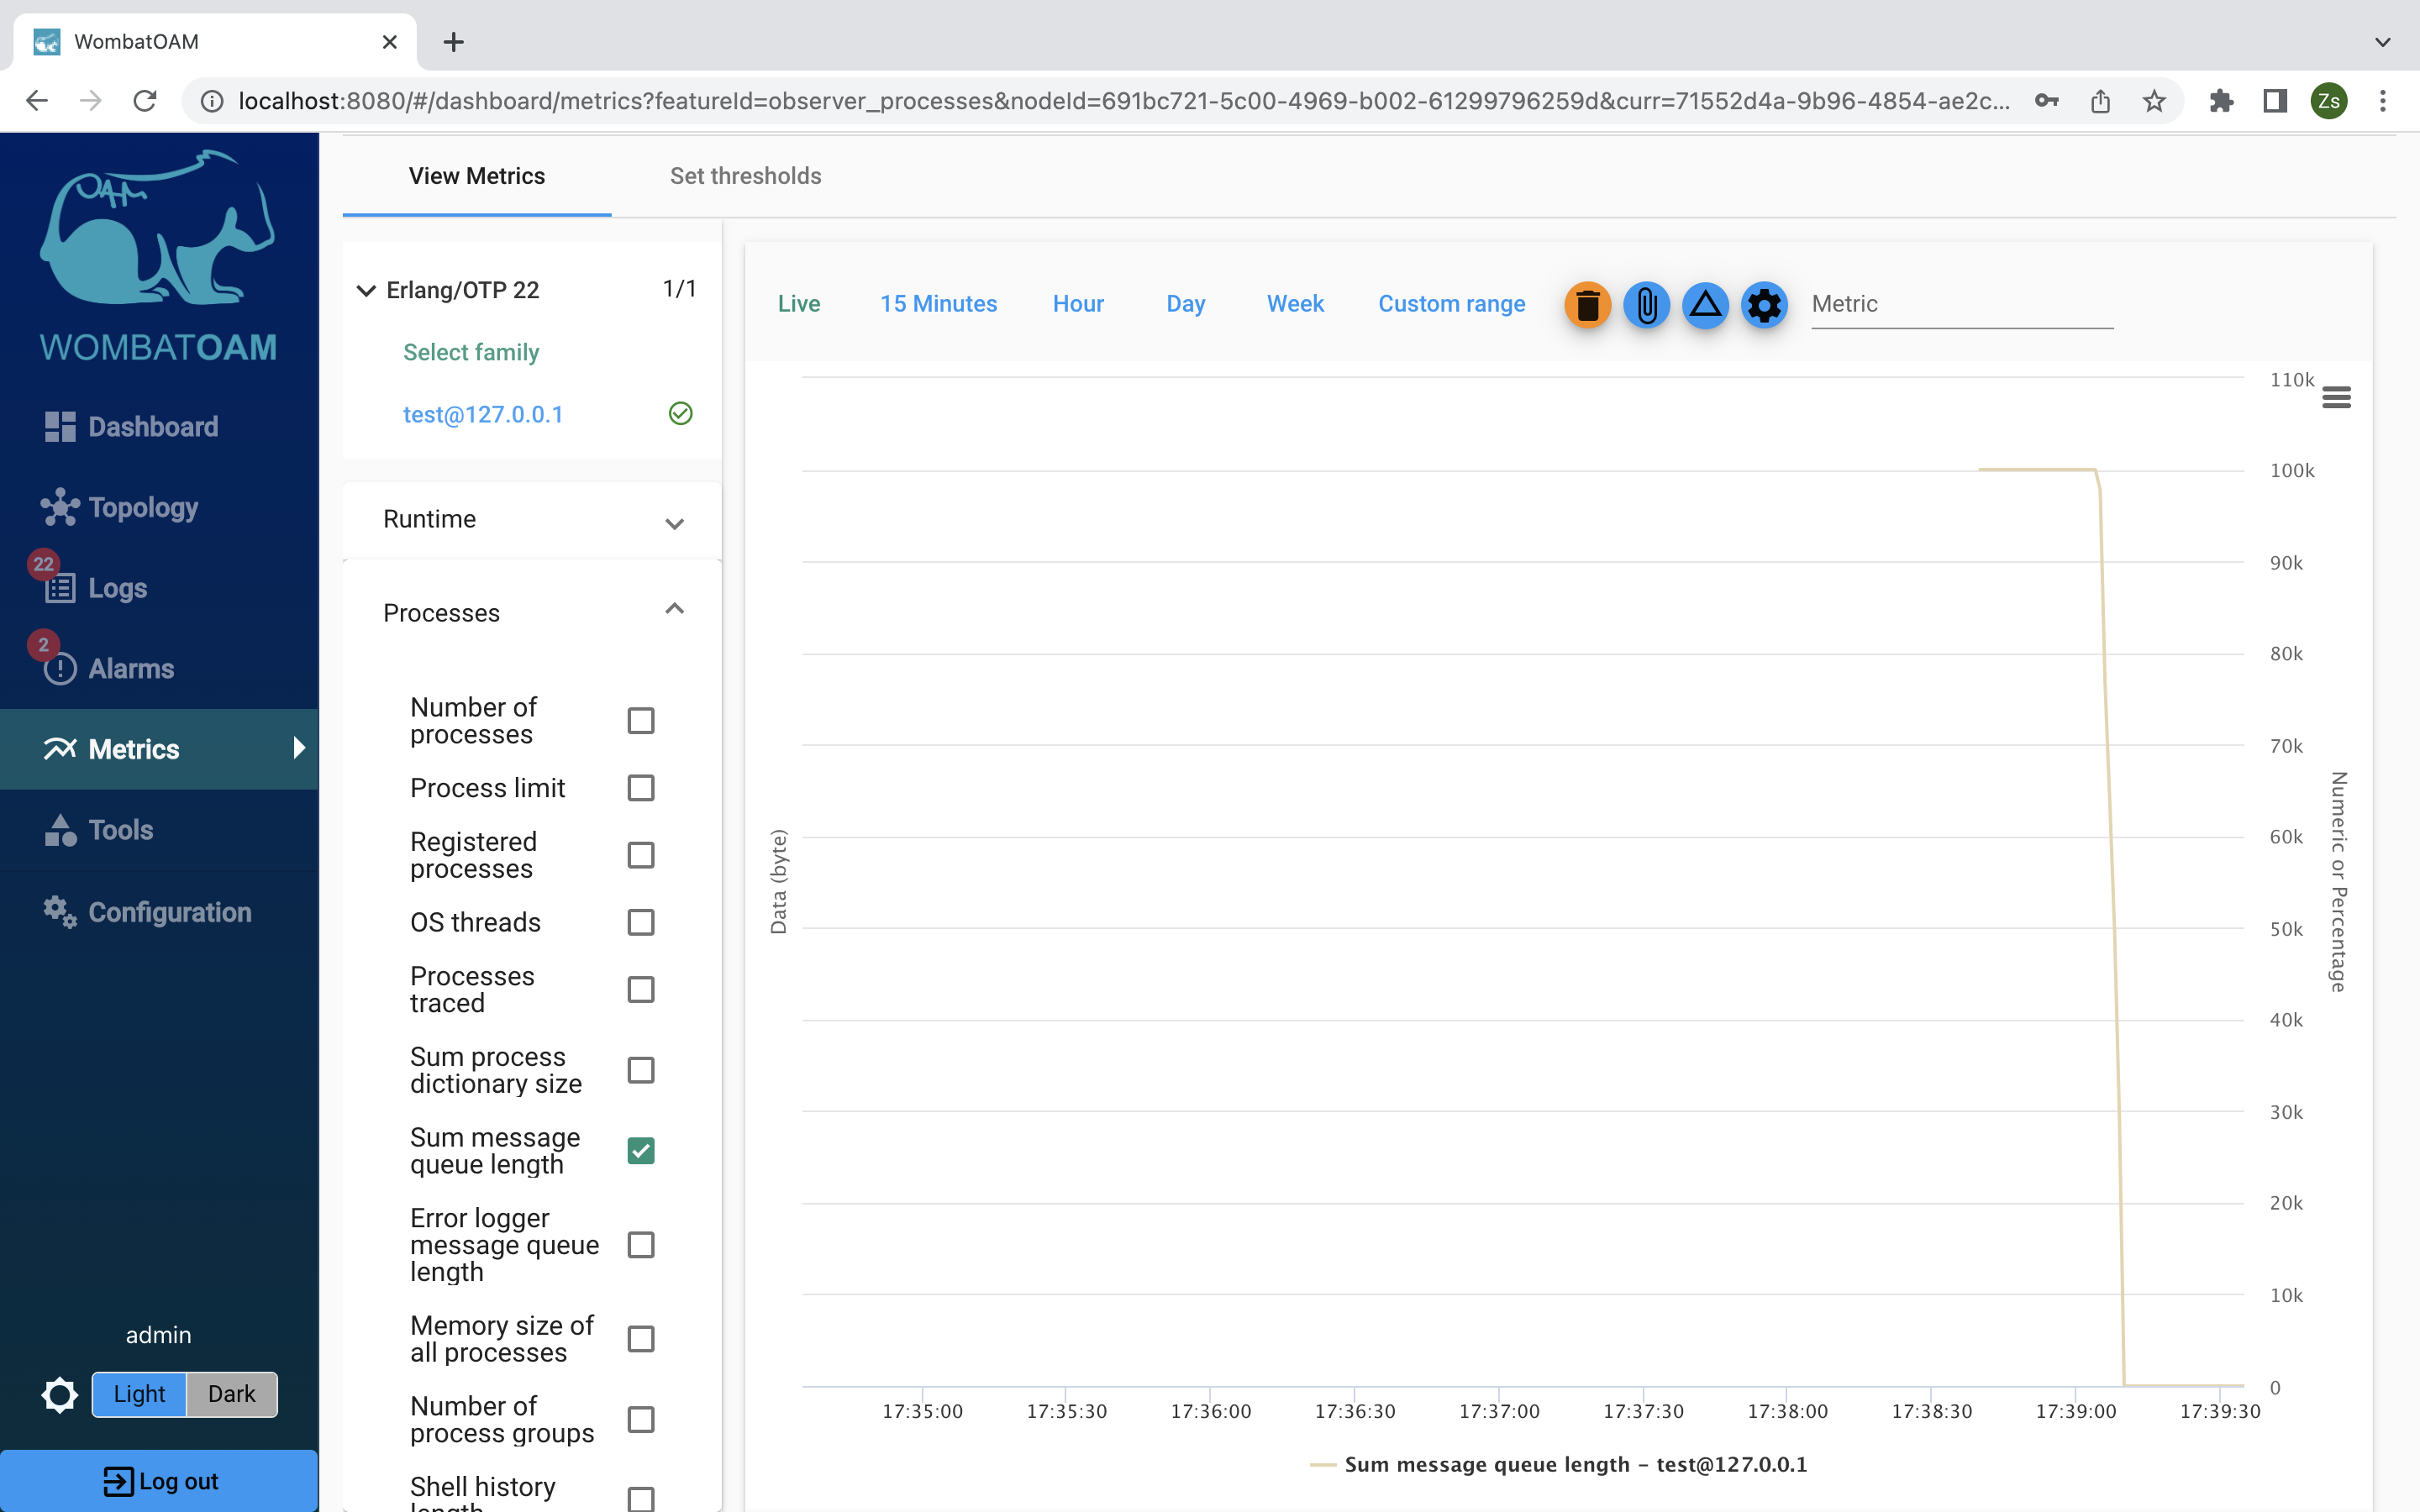
Go back to Metrics and clear all the metrics (click on the "trash" button at the upper right of the graph). Select the test node, go to the gauge tab and click Processes → Sum message queue length to see all the messages you sent to the shell.

Next, take it a step forward, and click Live. While you keep monitoring the message queue length in real time, enter the following in the shell:
1 | |
Notice how the graph drops as the queue is being cleared.
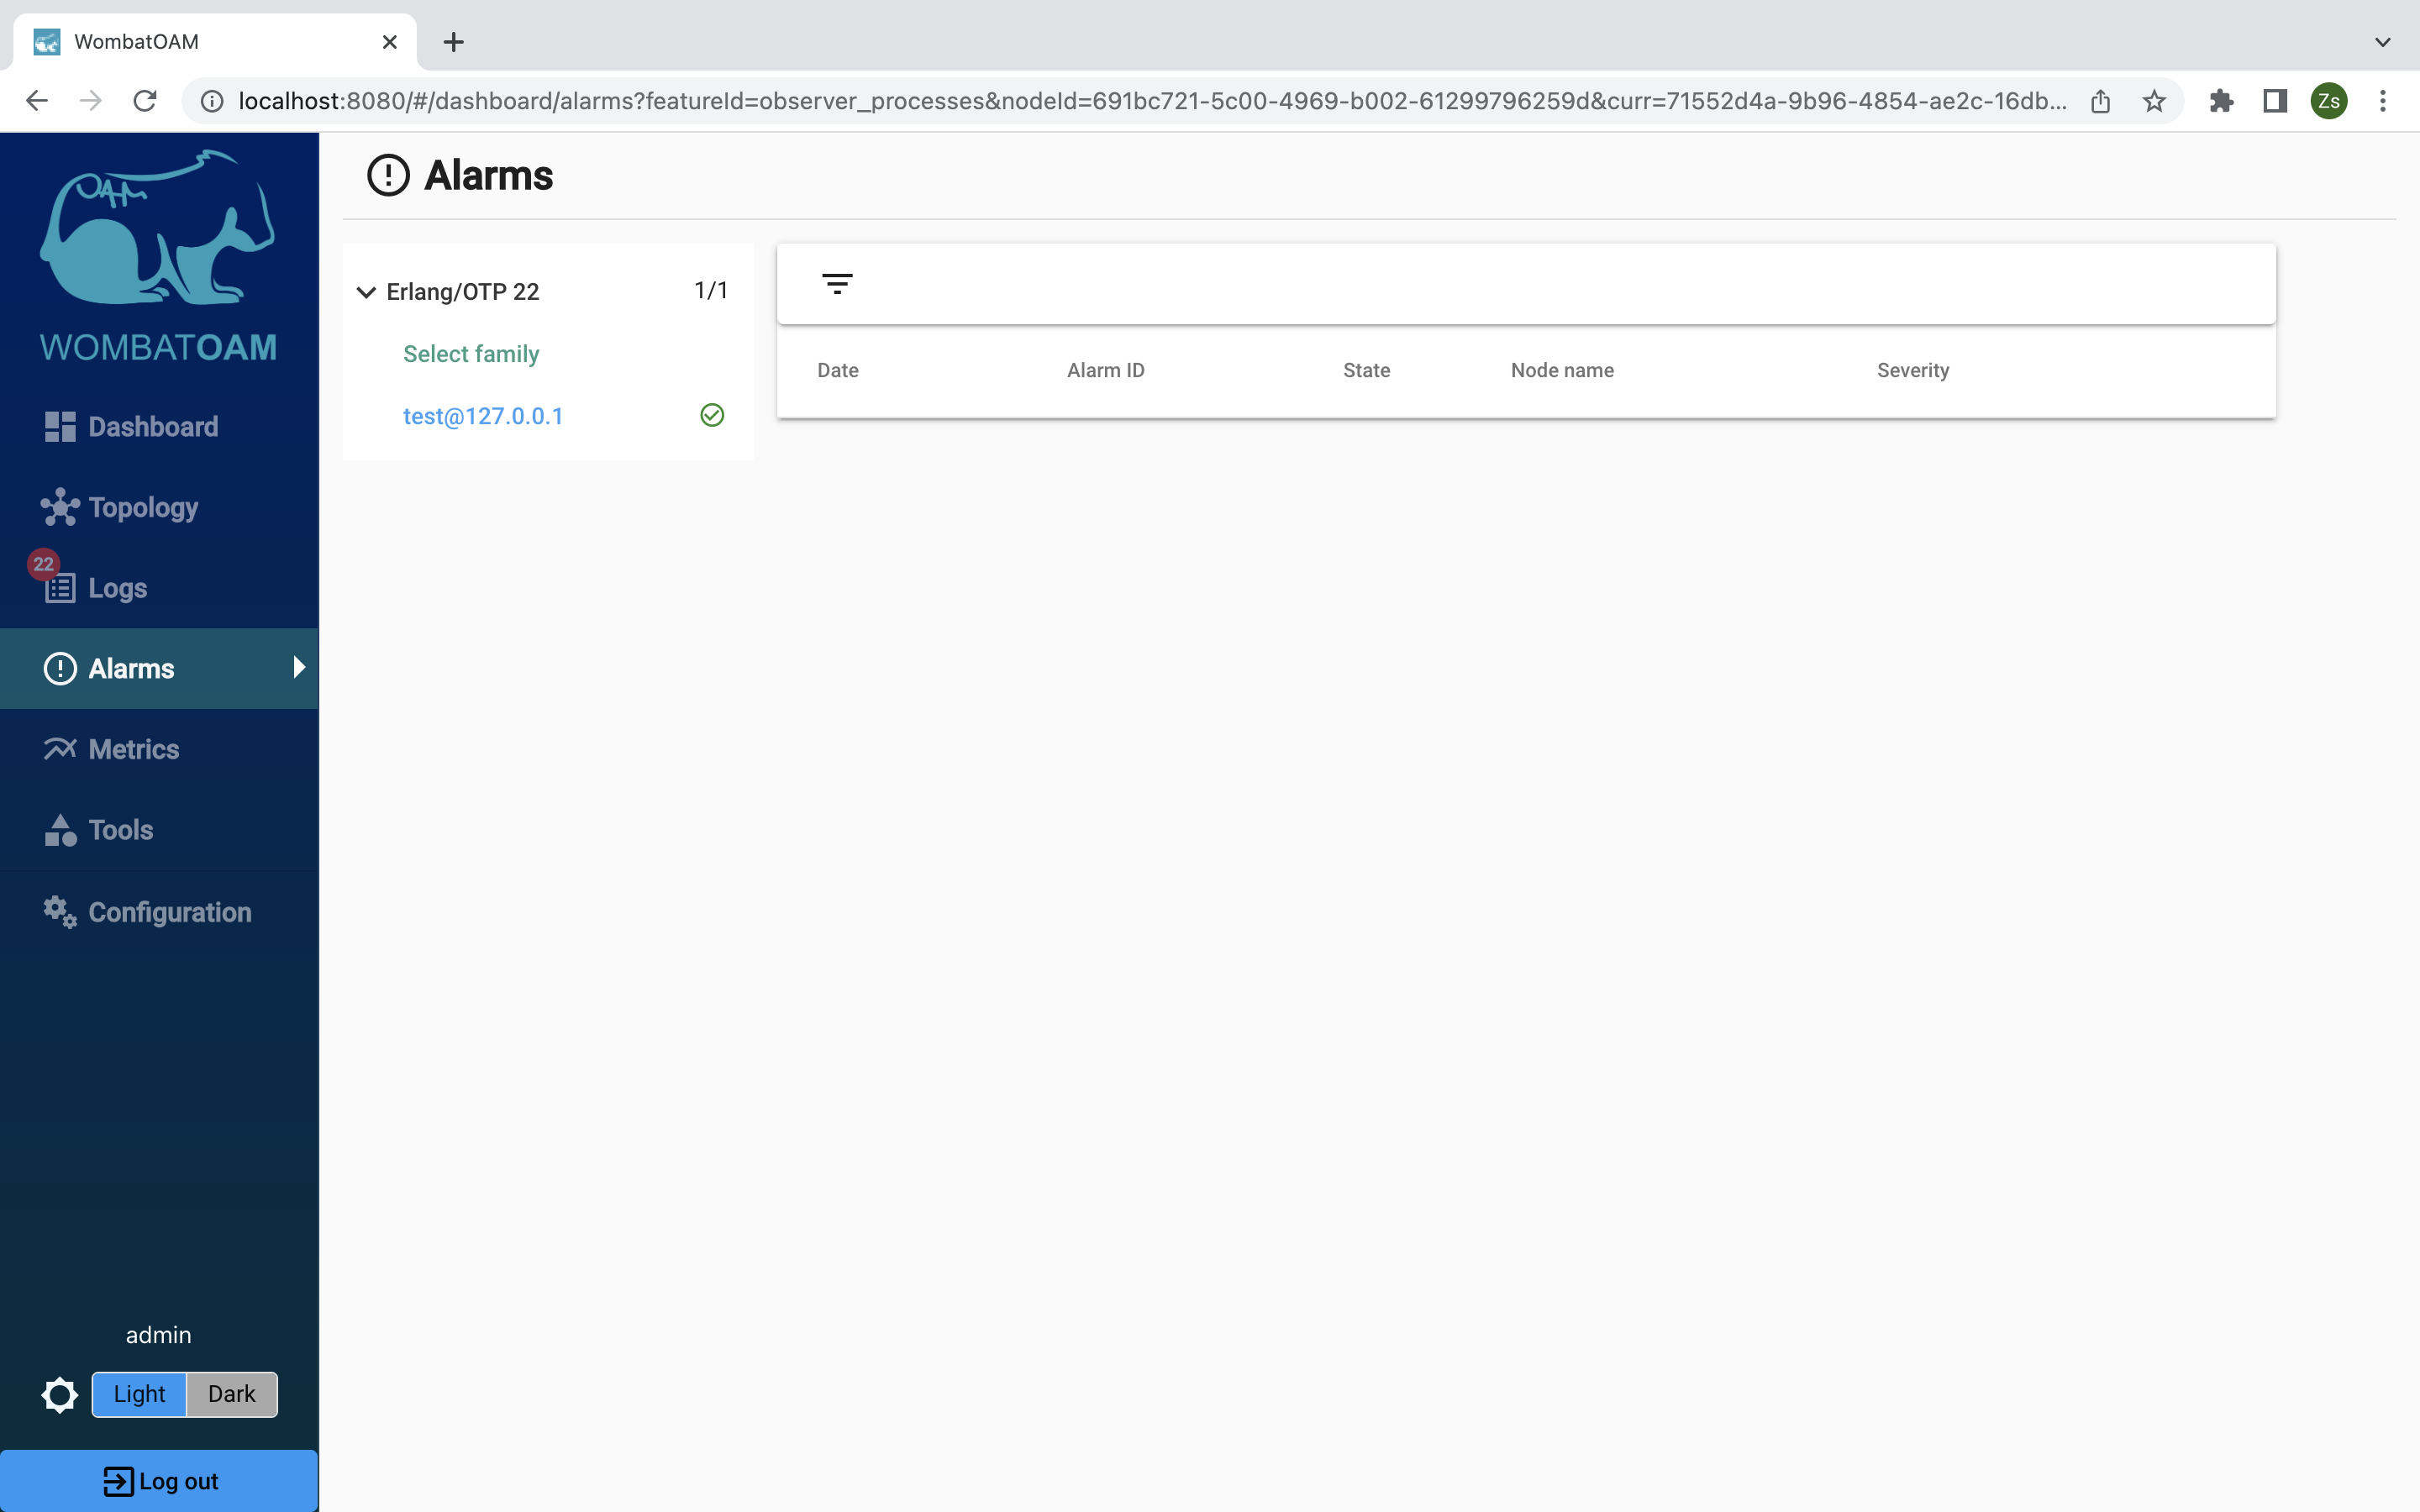
When the message queue is cleared, click on Alarms. You should see that the alarms have now disappeared. (You may need to give it some time to clear, as checks are made on average once a minute.)
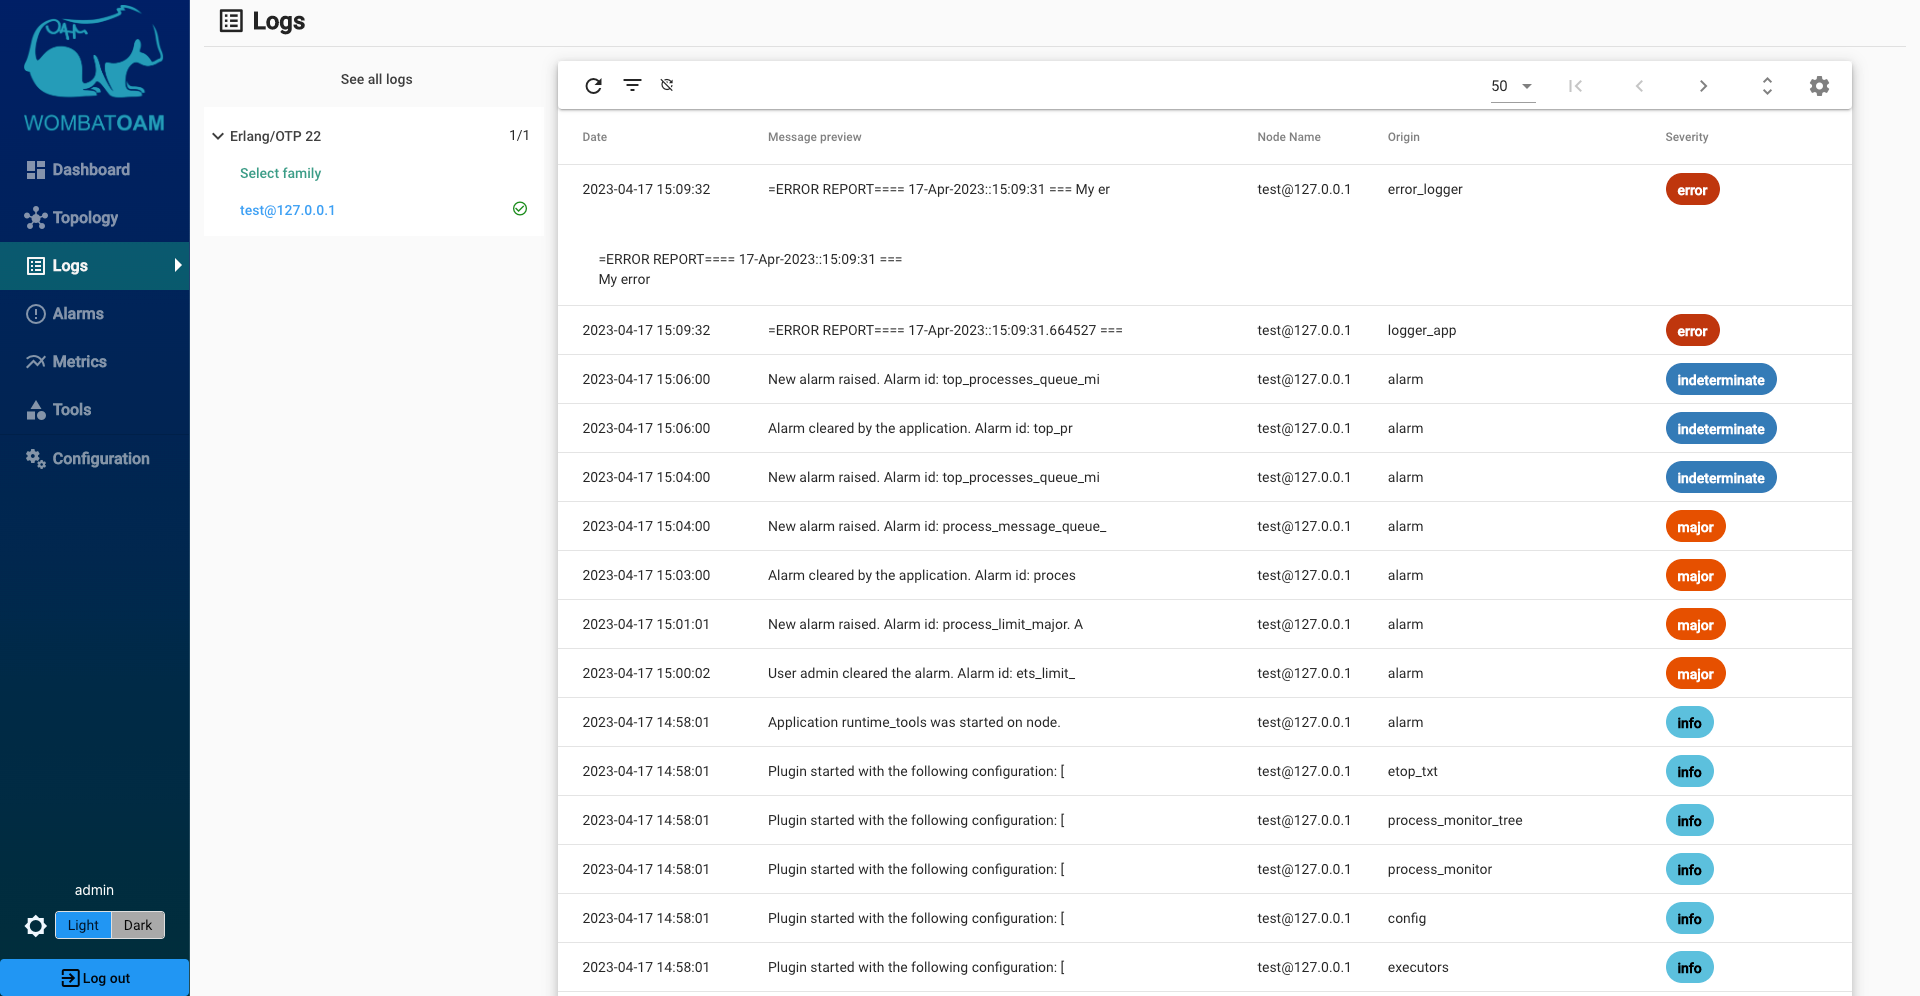
Go to the Logs page, and you should see logs from the code tracer and the alarm handler.
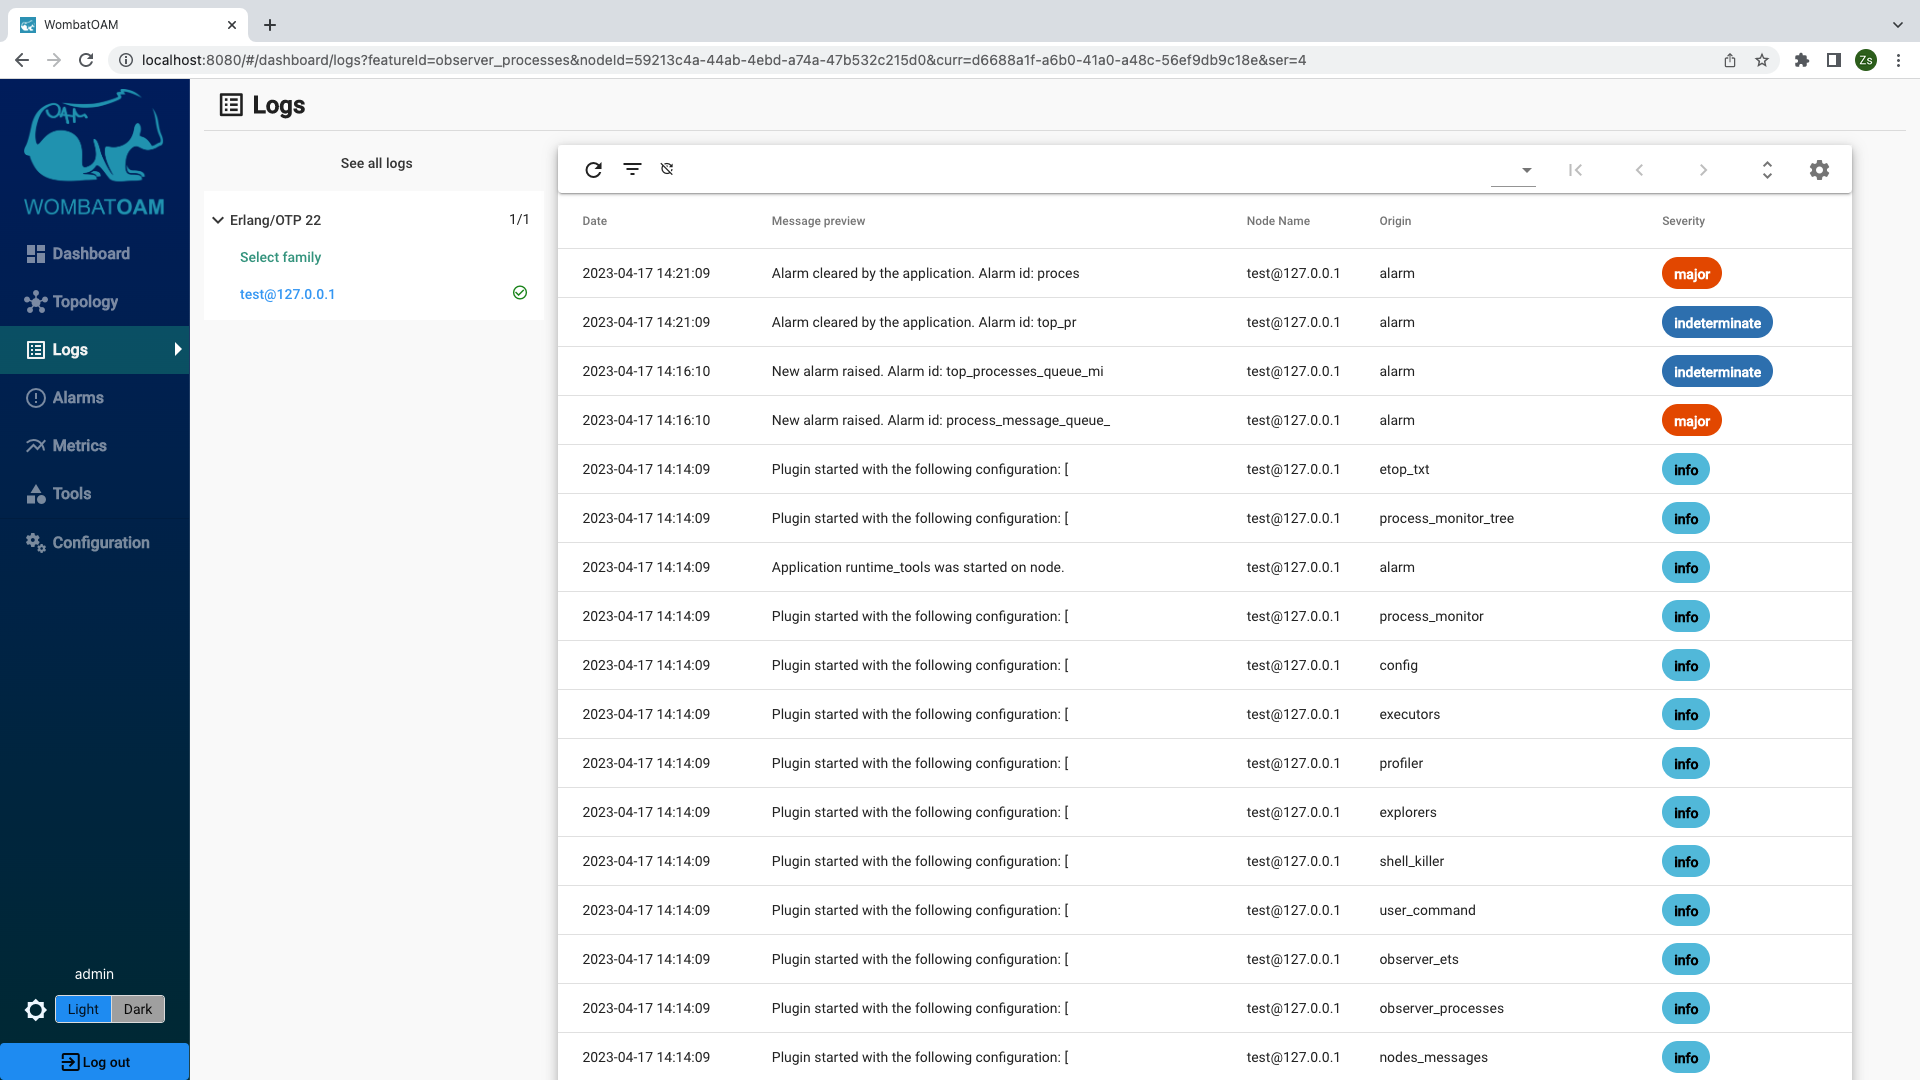
All alarms raised and cleared are logged under Logs, along with all shell interactions, modules loaded and purged, and so forth. You might not be sitting in front of your monitor and miss an alarm being raised and cleared – maybe missing that a message queue grew to 100,000 before being handled! You should check alarm logs regularly, and address them if necessary. Next time, it might happen that the queue length goes far beyond 100,000, causing the node to slow down and eventually crash.
Following these steps should show you how using WombatOAM might let you uncover problems that would otherwise have remained unnoticed. The following story from a WombatOAM customer attests to the importance of this kind of pre-emptive support:
"In one WombatOAM installation, all seemed to run as normal until we looked at the alarm logs. We noticed that twice in three days, three processes had reached a message queue length of 100,000, which got cleared without causing any issues. We narrowed down the cause to the process acting as a cache when the client connection was dropped for a longer time period. This became only visible in live systems, as client connectivity in the test plant worked well. Changes were immediately needed, as loss of network connectivity or a firewall misconfiguration between the perimeter network and that machine would have caused the connection to all clients to be dropped, resulting in the node running out of memory."
Further exploration
Below are some more things you can try out to get to know WombatOAM's functionality, focusing on alarms and logs. Try to keep an eye on relevant metrics – you can easily search for corresponding metrics by typing into the search box in the list of metrics.
Also notice the badges on the Logs and Alarms menu items – the numbers increment as new items are added. If new alarms are added while you are on the Alarms tab, or new notifications arrive while you are the Notifications tab, there will be a message above the list telling you that, with a link that you can click to show them. This prevents you losing your current view in cases where new entries arrive at a fast rate. There are navigation controls below the list to view older entries.
Alarms
Node down
The most basic alarm is node_down. To trigger this, you just need to stop the node that you are running and monitoring. If you started the node in the shell, you can press Ctrl-C to stop the node, or enter the following:
1 | |
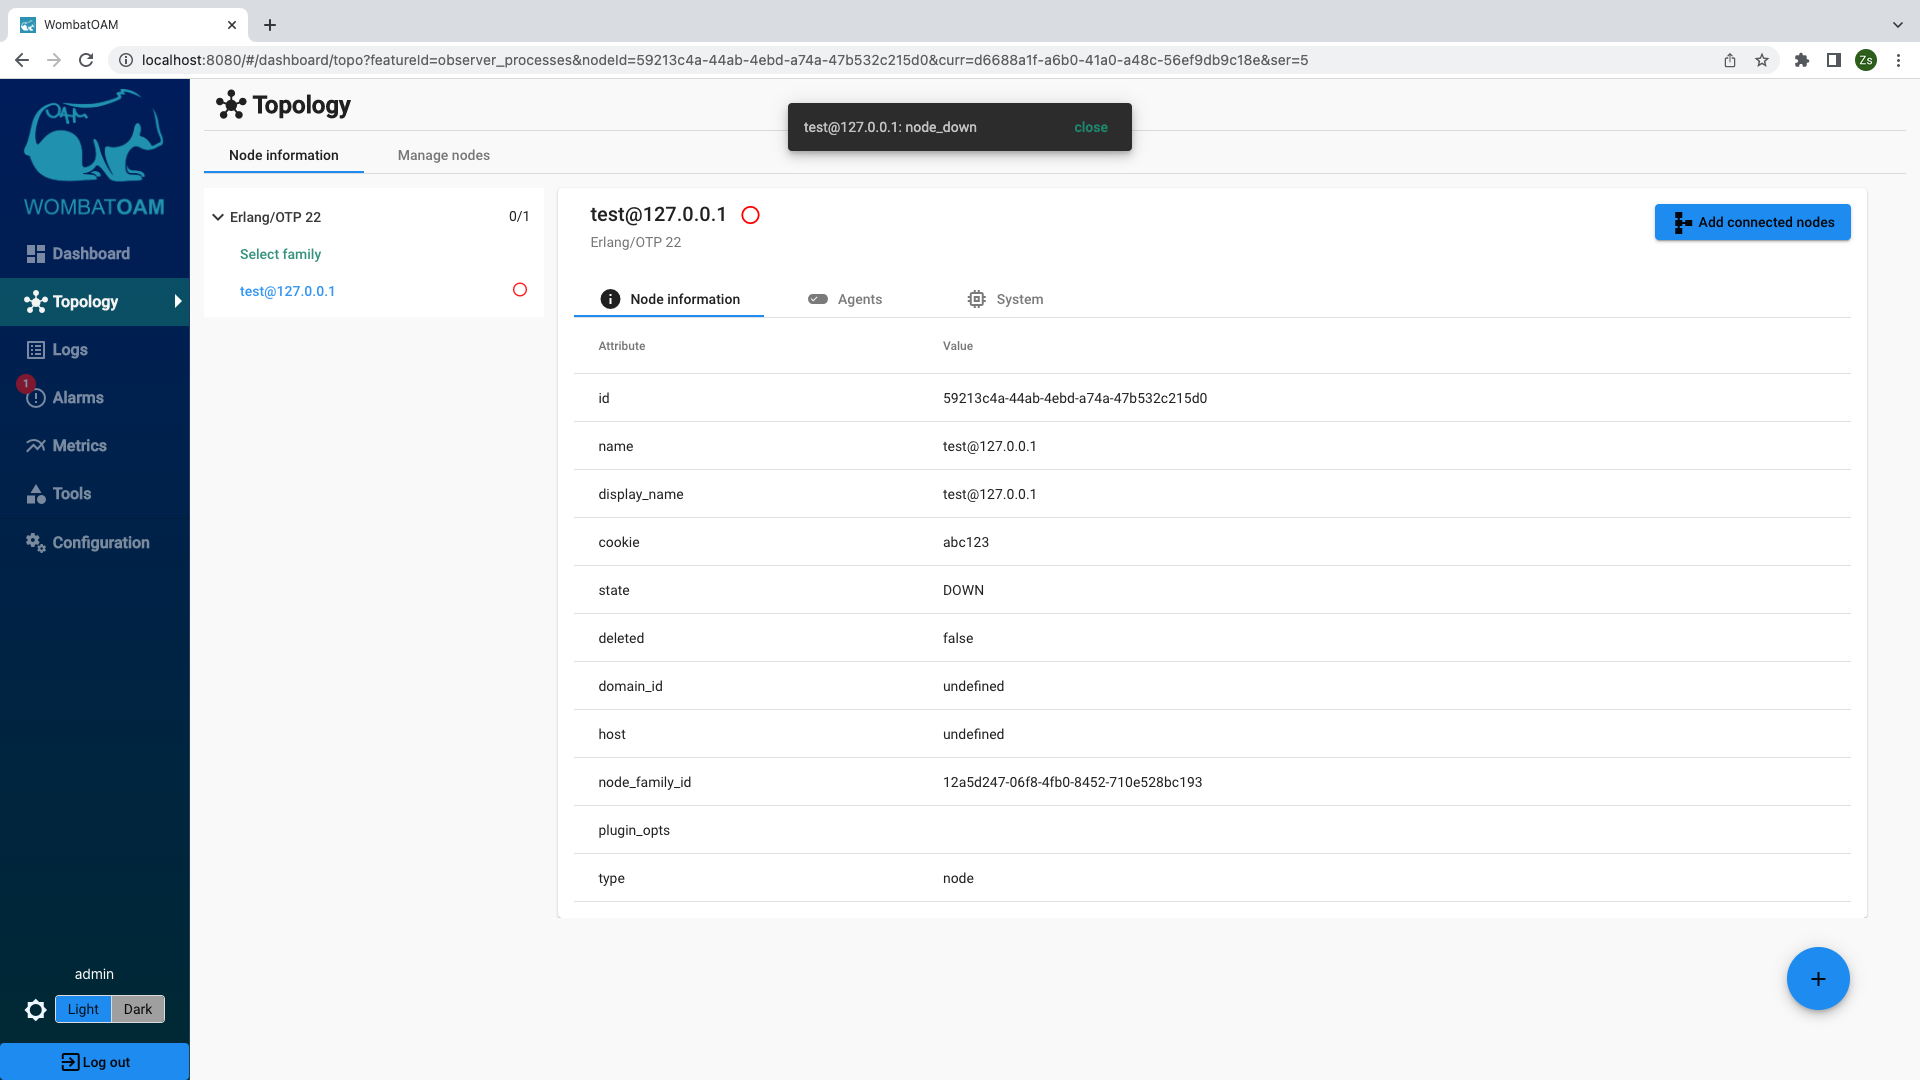
WombatOAM will show that the node is down, and also show an alarm (look out for the popup notification) after a brief moment. After this, restart the node. Again, WombatOAM will automatically notice (within 30 seconds) that it is up again, and the alarm will be cleared.
Hitting system limits
Filling the atom table
Converting values into atoms without any control can fill the atom table. To try this out, enter the following command in your Erlang shell:
1 | |
You should get the following alarm: atom_limit_major
This alarm is may be an indication of unsatisfactory code that dynamically turns strings into atoms. Since the atom table is not garbage-collected, the only way to recover from this situation is to restart the node.
Converting user inputs into atoms can also easily hit the system limit, since the atom table can only grow. Usually the table grows slowly, so the node doesn't crash immediately, but only after a long period of time (for instance, after two months).
You should restart the node after trying this out.
Creating too many ETS tables
Enter the following command in your Erlang shell:
1 2 3 4 | |
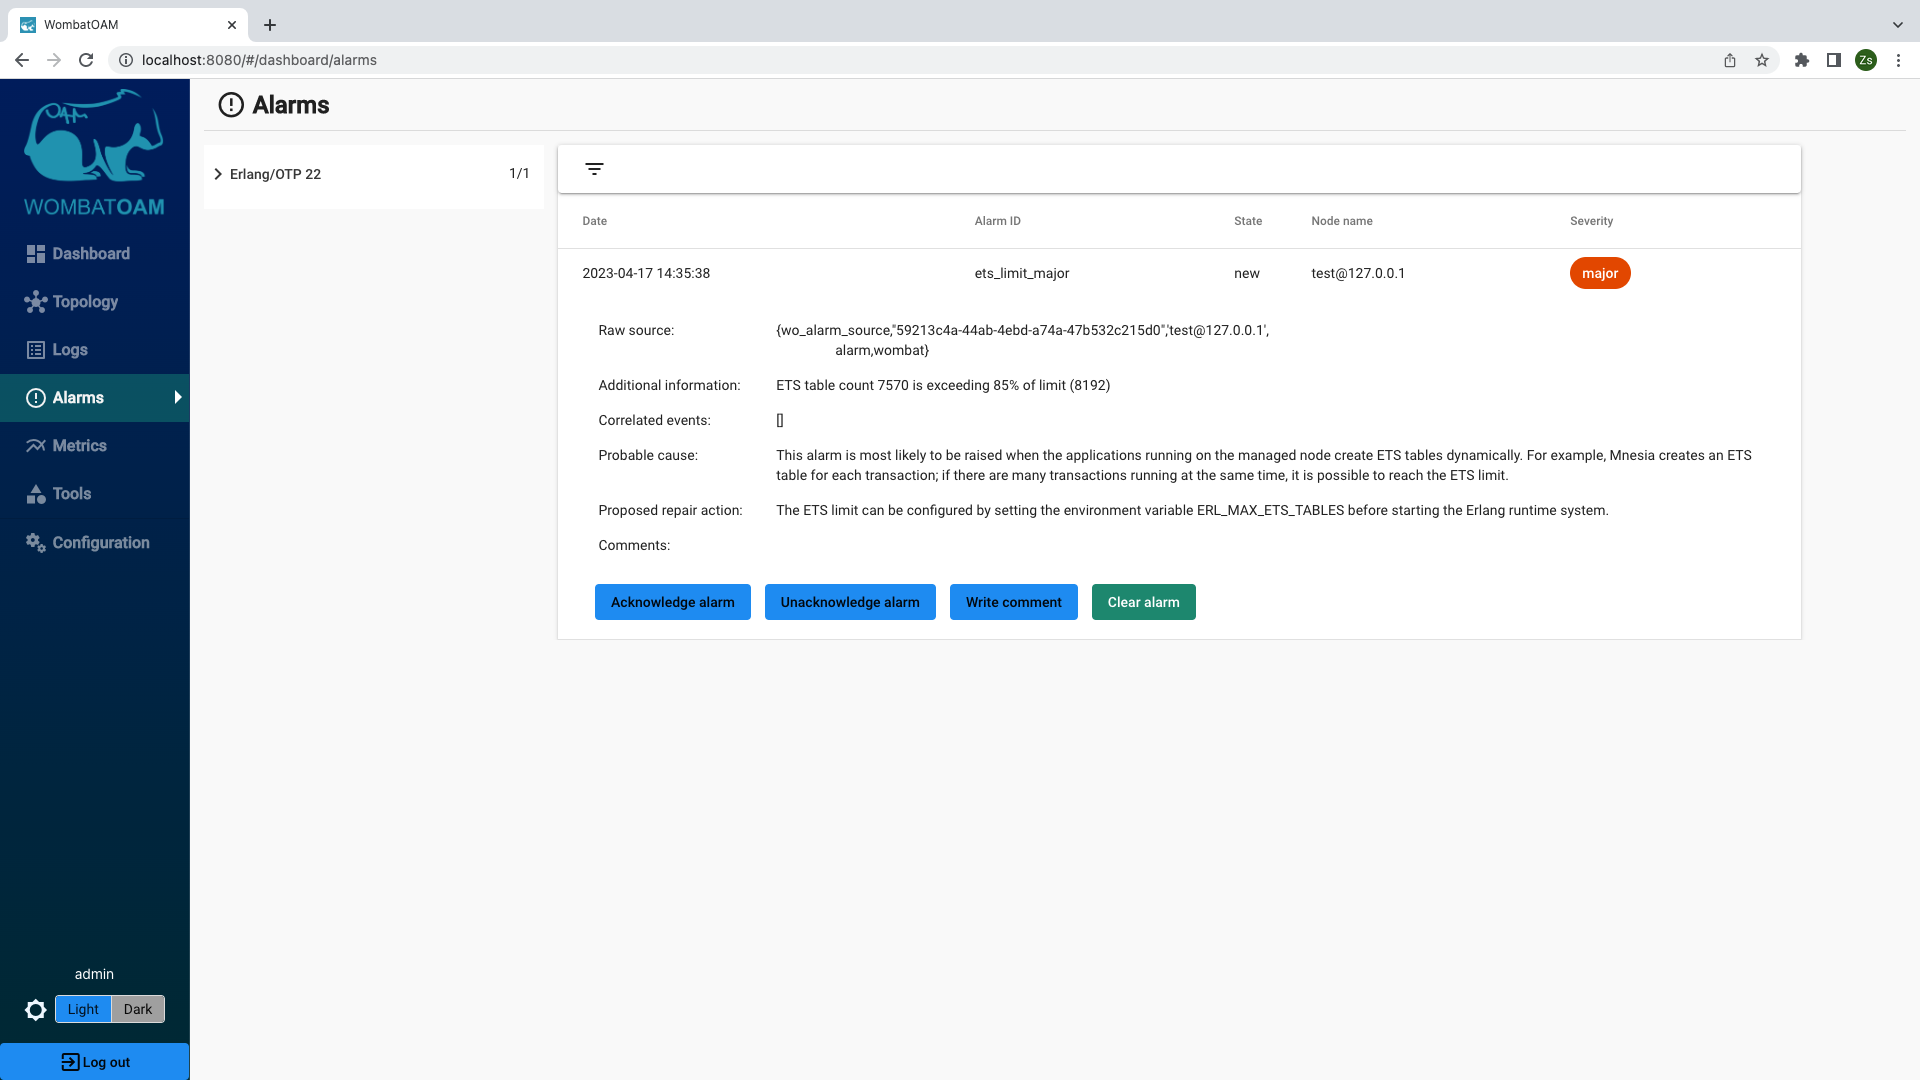
You should get the following alarm: ets_limit_major
If you don't get the alarm, it may be because your system limits differ from the defaults. Try this alternative instead, as it first determines the system limits:
1 2 3 4 5 6 7 8 9 10 | |
Hitting the limit of the number of ETS tables can happen quite easily, as there is no automatic garbage collection for tables. Even if there are no references to a table from any process, it will not automatically be destroyed unless the owner process terminates. Imagine a permanent server process creating new ETS tables for new sessions. If there is a spike in requests, you might hit the limit. This alarm is also seen when executing many simultaneous mnesia transactions, as each transaction creates a dynamic ETS table.
Now, it is a good time to explore another service provided by WombatOAM. Go to Tools and select the node to which you issued the command. Open the Explorers panel and click on Table Visualizer. Click on the Name column header to order the tables by their names.
A listings will appear showing the ETS tables with their properties.
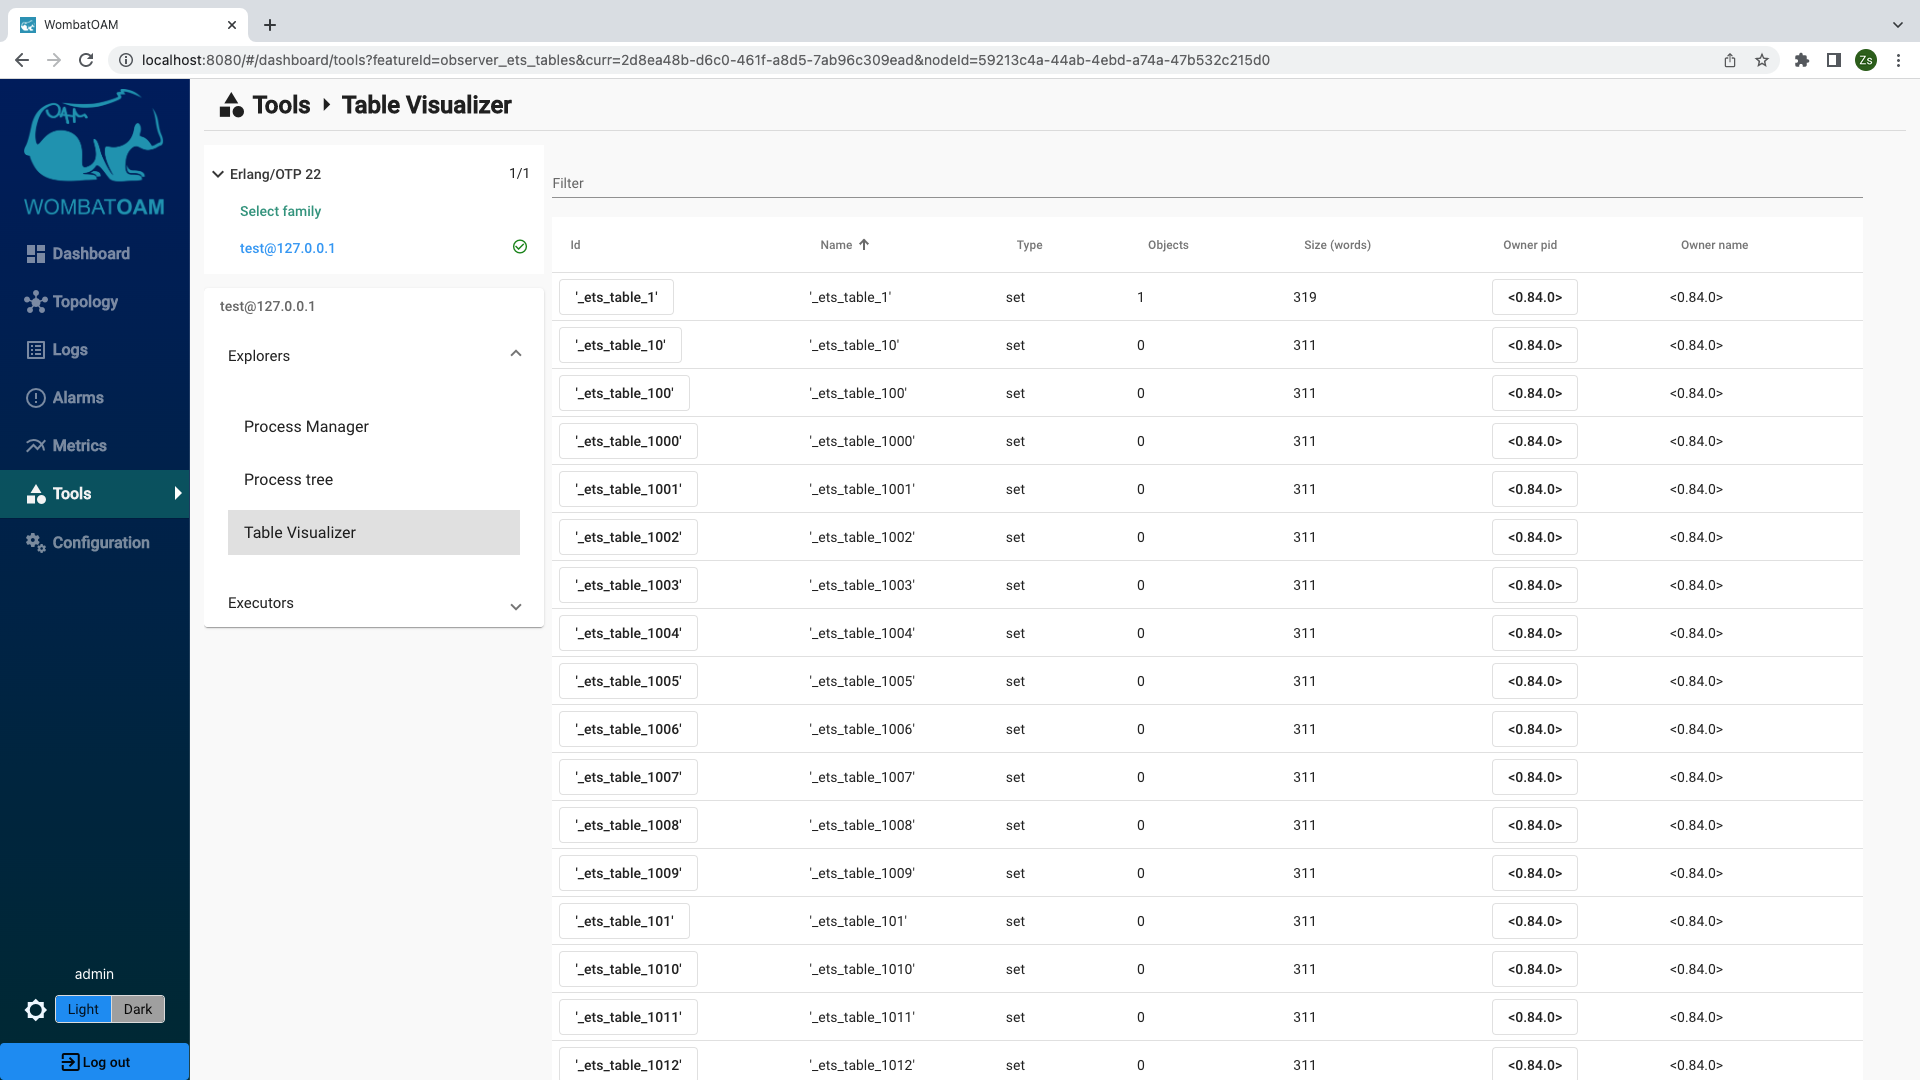
Clicking on the '_ets_table_1' link in the first row shows the content of that table.
In the Table Visualizer, click the pid of the owner process which created these ETS tables. A local menu with the same content we saw at Etop has appeared with infromation about the process.
Process limit
The maximum number of simultaneously alive Erlang processes is by default 32,768 (this limit can be configured at startup). To trigger an alarm where the number of processes approaches this limit, enter the following commands into your shell:
1 2 3 | |
If you don't get the alarm, it may be because your system limits differ from the defaults. Try the following alternative, which determines the system limits first:
1 2 3 4 5 6 7 8 9 | |
Within about a minute, the following alarm should be raised: process_limit_major
Spawning a process is very easy in Erlang, and serving each request by a new process increases the system's throughput. However, the system limit will be reached if the processes can't terminate as they are waiting for a resource, or the number of arriving requests is much larger than expected.
Had this alarm been monitored, we would probably have gotten an early warning that the following node's process limit had to be reconfigured:
"We were supporting a really old installation of Erlang where the processes limit was set to the default value of a few hundred thousand. A firewall misconfiguration caused all of the client connections to fail. The connectivity towards the node was down for five minutes, resulting in more and more users hitting the retry button. When the firewall configuration was fixed, one of the front-end nodes managing the connectivity was hit with so many requests, reaching the process limit and terminating the node. This caused all the clients to reattempt connecting to the remaining nodes, resulting in a cascading failure where all the nodes went down one by one."
Long message queue
After triggering the previous alarm (process_limit), wait 2–3 minutes. Another alarm should be raised: process_message_queue_major
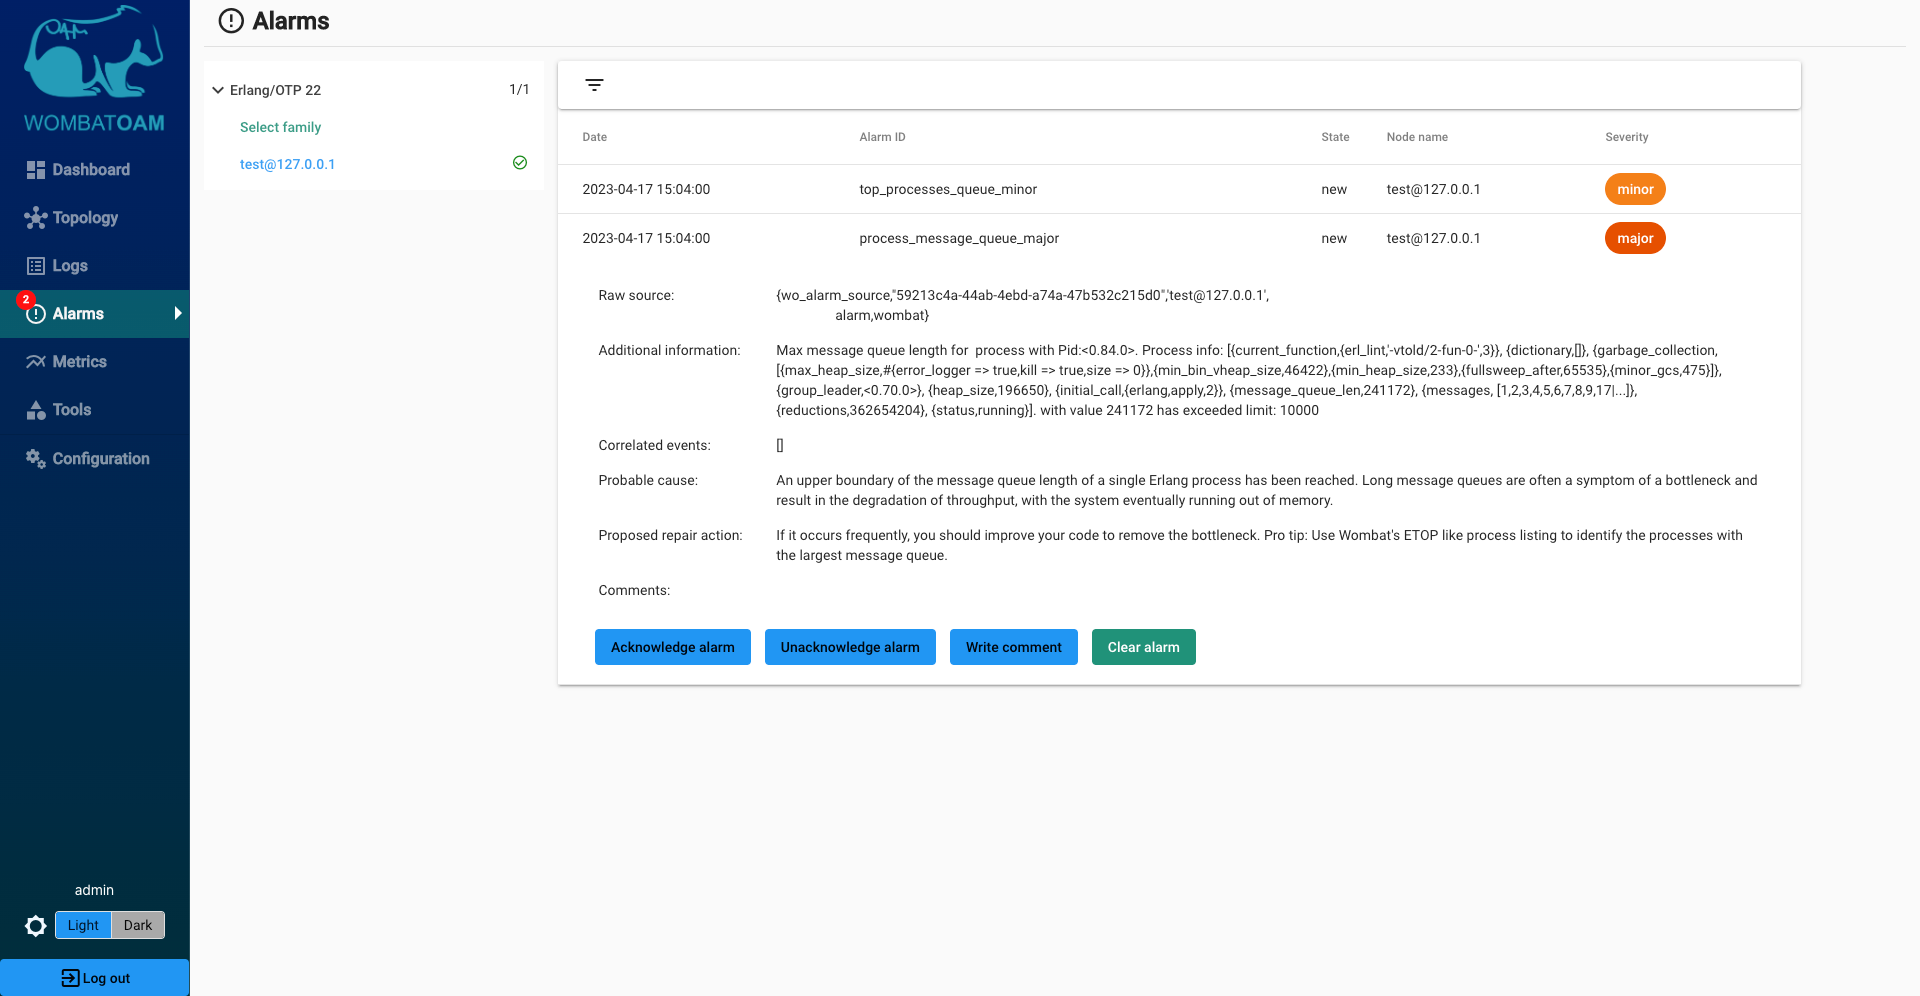
This alarm means that an upper boundary of the message queue length of a single Erlang process has been reached. Large message queues are early warn signs. Generally speaking, a large message queue can indicate that a) your system is not totally well-balanced; b) new tasks arrive to a process in bursts; or c) a process is being stalled because it is waiting for something. If you see no reason for large message queues, or the alarm isn't cleared automatically, you should investigate the issue further to avoid possible outages.
After this, you should clear the message queue alarm. Enter the following in the shell:
1 | |
Learning more
To find out more about memory and system limits, see the following official Erlang documentation: http://www.erlang.org/doc/efficiency_guide/advanced.html
Logs
Log entries
WombatOAM can aggregate errors and warnings coming from logging applications such as SASL or Lager. You can trigger SASL log entries to see how WombatOAM responds and shows you such events. In the node you are running, enter the following:
1 | |
You will see the error_logger notification in the list of notifications for your node:
If Lager is also running on your node, you will see the lager notification, too.
Tools
Functionalities under Tools are several standalone features, which are not metrics, logs or alarms, but aid devops with their daily tasks. It is handy for troubleshooting, online diagnosing and resolving problems and incidents on the fly.
You have seen how you can exploit the Etop-like process listing, the ETS table viewer, the various process inspectors.
To experiment with these features, first start two Erlang nodes and add them to WombatOAM.
1 2 | |
User command executor
This service allows users to execute arbitrary Erlang expressions on the nodes and the result of the execution is shown to the users.
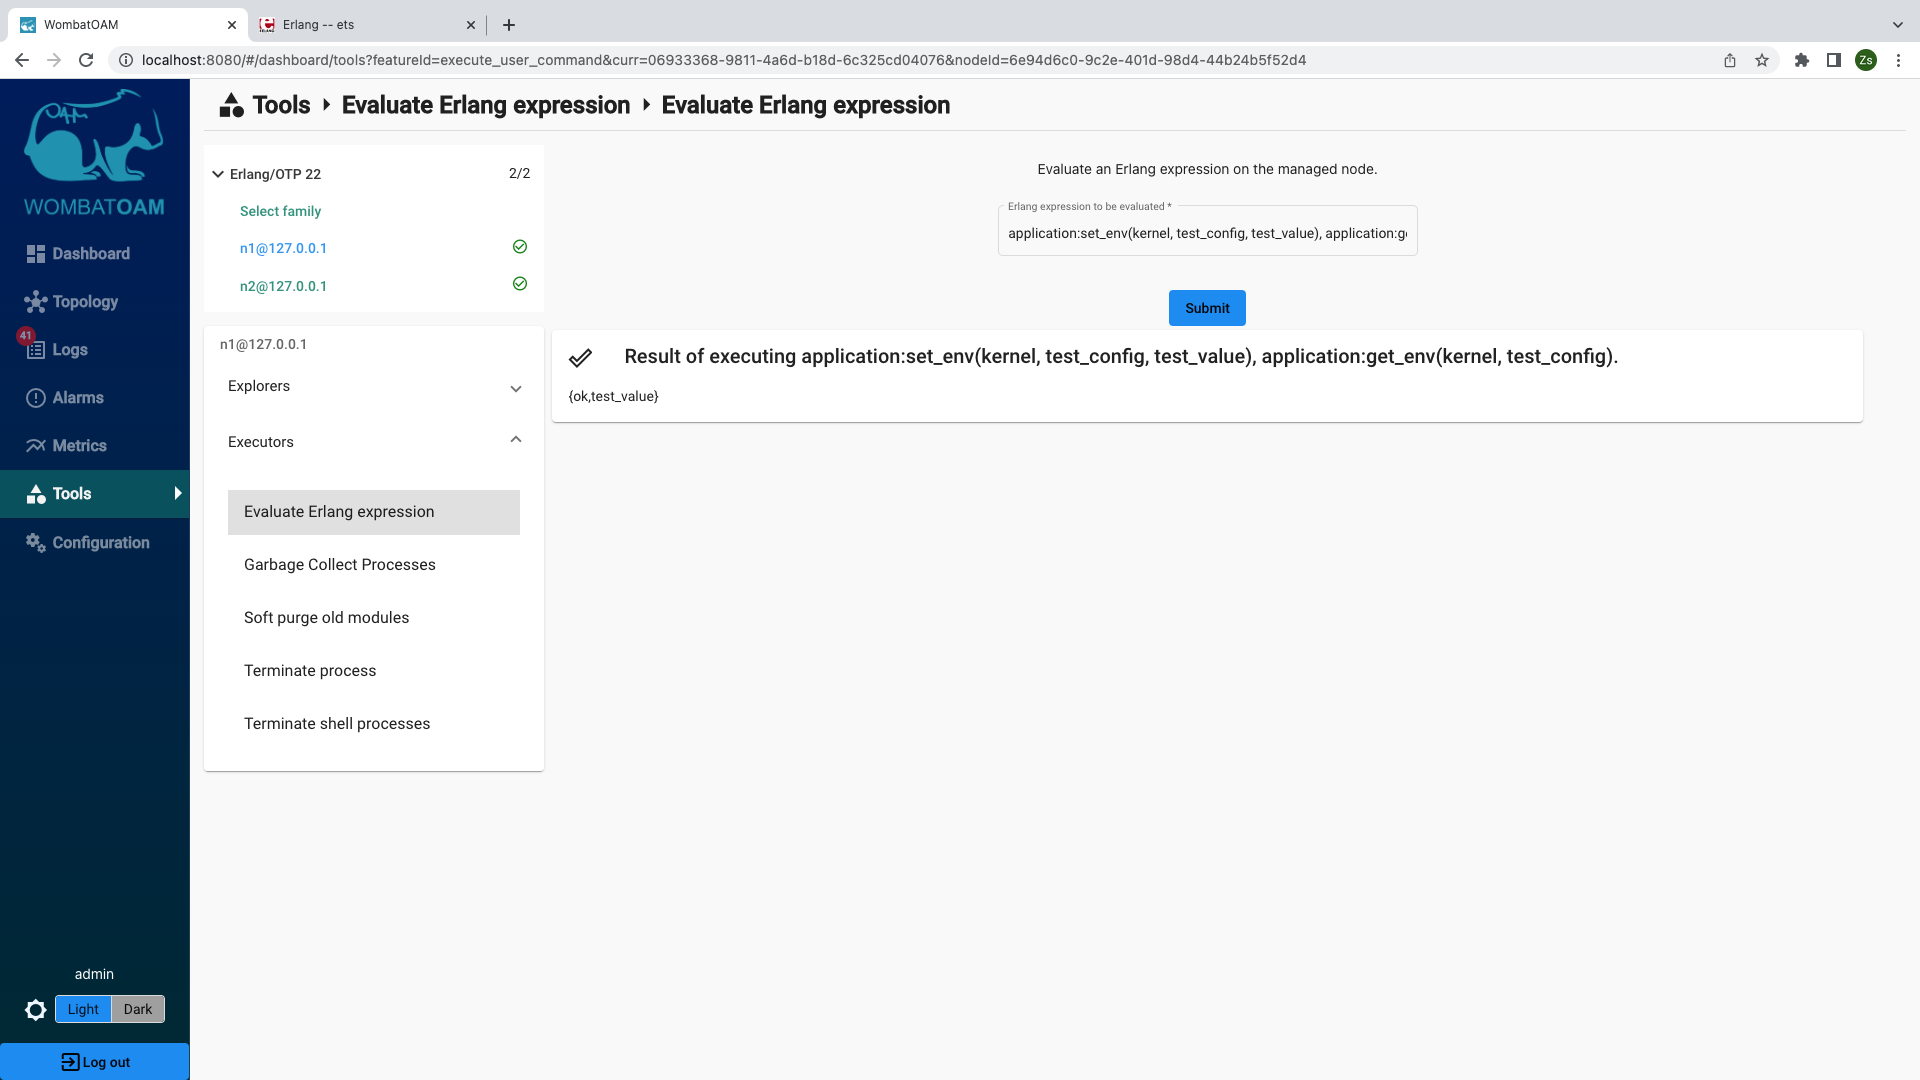
Go to Tools → select the n1@127.0.0.1 node and under Executors click on
Evaluate Erlang expression panel. Copy the following Erlang expression into the
input field and start the request.
1 2 | |
This will associate test_value with the kernel application's
test_config parameter, and then will return the current value of the same
parameter, which will be the result of the request.
Use this service to retrieve information specific to your business logic or adjust your system to the current requirements. However, if there are commands you often use, you may consider adding them as new services. Implementing your own service is easy and will speed up your maintenance processes.
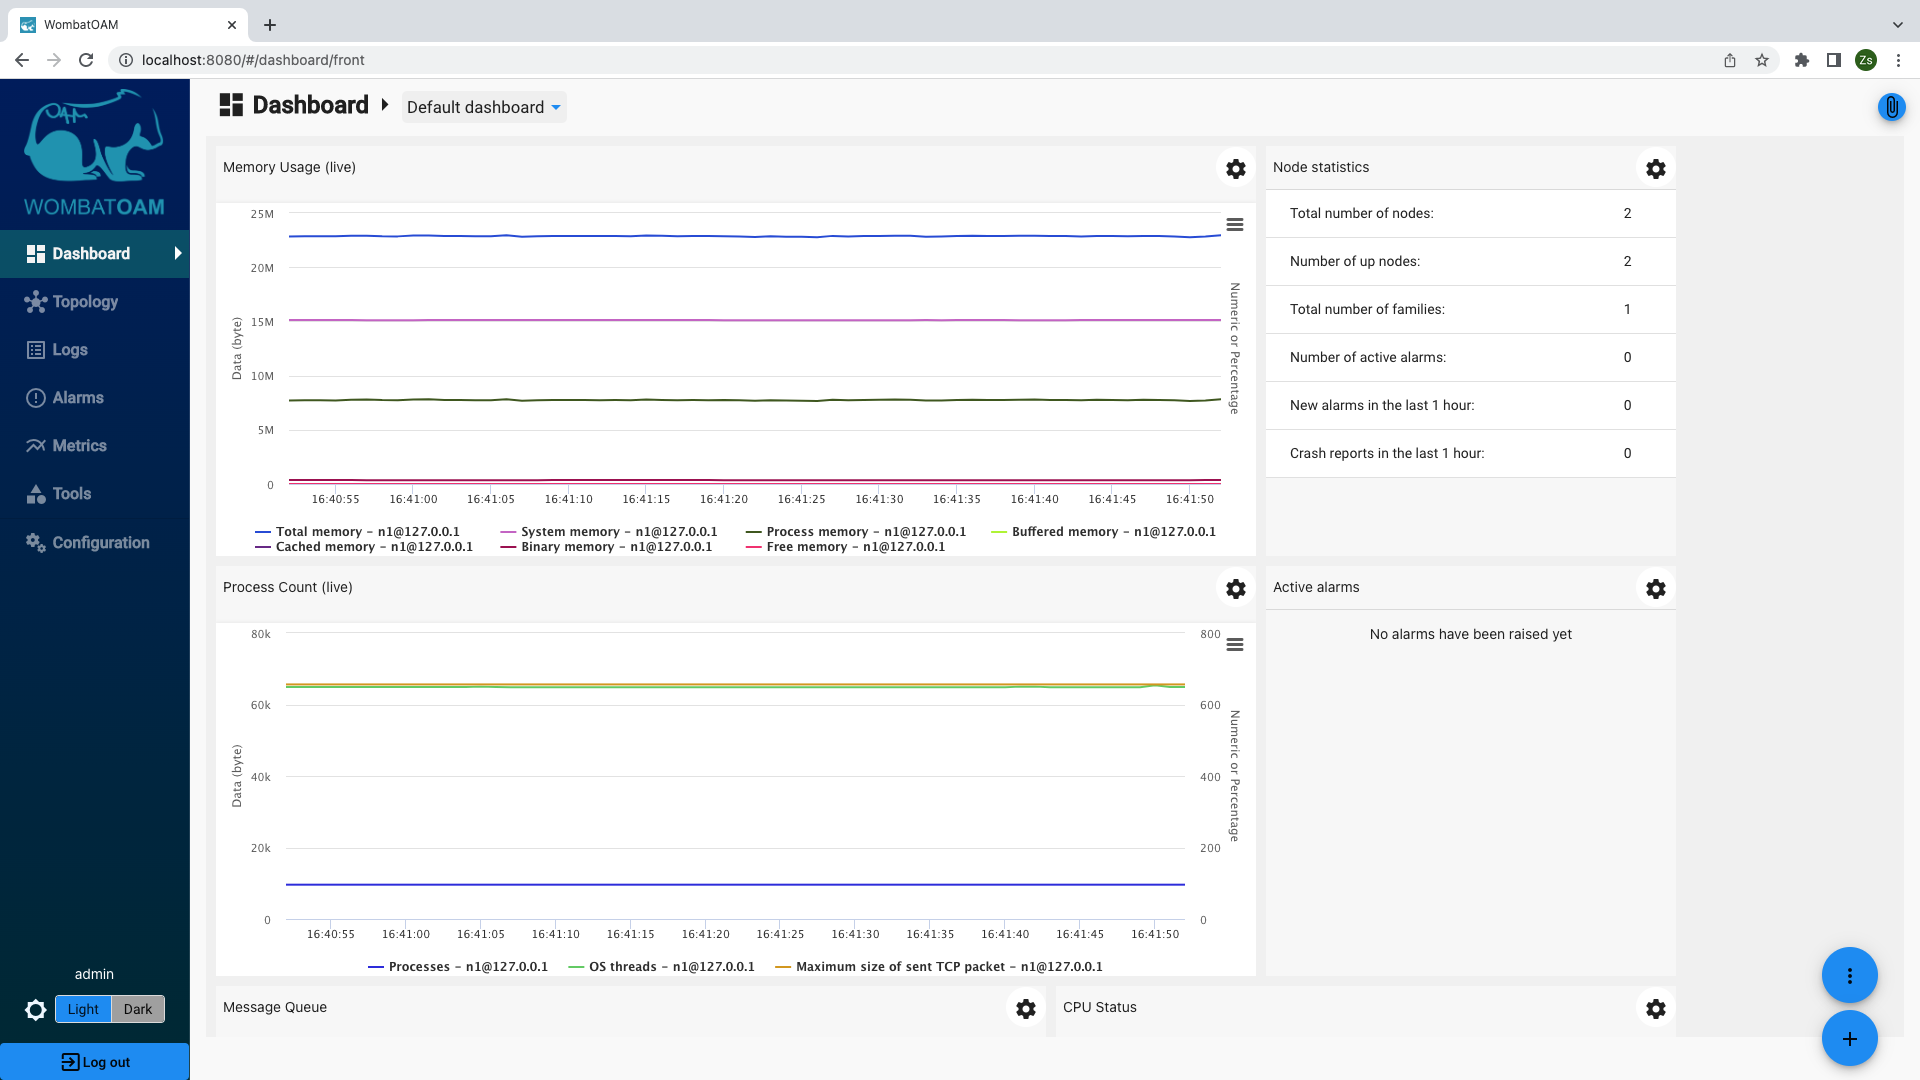
Dashboard page
WombatOAM's Dashboard page gives a brief summary about the current state of your system. By default it shows the most helpful metrics, the active alarms and general statistics. It is easily customisable, e.g. graphs with any groups of metrics can be added to the page.
More stories from the front line
In the following stories, we'll see how WombatOAM addresses real-life problems that customers have encountered.
From a major mobile network operator
"I had a node crashing and restarting over a 3 month period at a customer site. Some refactoring meant they were not handling the EXIT signal from the ports we were using to parse the XML. Yaws recycled processes, so every process ended up having a few thousand EXIT messages from previous requests which had to be traversed before the new request could be handled. About once a week, the node ran out of memory and was restarted by heart. The mailboxes were cleared. Our customers complained that at times, the system was slow. We blamed it on them using Windows NT. We saw the availability drop from 100% to 99.999% (The external probes running their request right during the crash or when the node was restarting) about every 4 weeks. We rarely caught this issue as external probes sent a request a minute, took half a second to process, whilst the node took 3 seconds to restart. So we blamed it on operations messing with firewall configurations. With triple redundancy, it was only when operations happened to notice that one of the machines running at 100% CPU that we got called in. Many requests going through the system, I thought, but it was only 10 requests per second. Had we monitored the message queues, we would have picked this up immediately. Had we had notifications on nodes crashing, we would have picked up after the event."
WombatOAM would have raised three alarms as a result of the above issue: an alarm when the message queue of a process exceeded certain thresholds, another when it reached a high memory utilisation, as well as one when the node was down. Even if alarms were cleared, following up on them would have lead to the memory metrics, showing the increase in memory usage; more specifically, in the process memory usage. This would have led us to look at the other process related metrics, spotting that the message queue was growing out of hand.
From an enterprise Riak user
"A customer having a Riak cluster with 5 nodes reported that one Riak node crashed without any early warning signs. The customer reported that no maintenance activities had been performed on that node before the crash occurred. After long hours spent on investigating the issue, ESL pointed out that the root cause was a recent configuration change that increased the number of concurrent hand-offs 50 times larger than its default on the bad node. This change allowed the node to accept so many transactions that made the node totally overloaded. After reverting this change the cluster started functioning properly again."
Here, WombatOAM would have logged a notification and raised an alarm: a notification about the configuration change, and an alarm about the inconsistency of the global config's values. Using the configuration management service, the misconfiguration would have been fixed quickly.
Runaway modules
"Someone tried to patch a module, loaded it, saw that it did not fix the bug and deleted the beam file, not knowing he had to purge the module as well. An engineer wasted a whole week figuring that one. That is why we have an Alarm if nodes of the same type run different modules."
If more than one node of the same type existed, WombatOAM would have raised an alarm that the two nodes were running different versions of a module with the same name. To find out how that came about, you would have looked at all of the code related notifications on that node, and finally, narrowed it down to the shell command.
File sanity check
"There was a software upgrade in real-time which required upgrades of the Erlang Environment variables. Operations upgraded the sys.config file, copying and pasting from a word document, invisible control characters included. Months later, a power outage caused the nodes to be rebooted. But because of the corrupt sys.config file, they would not start. The error messages in this case were so cryptic and the control characters in the sys.config file not visible, it took us a few hours to find out what the issue was and restore the service."
WombatOAM regularly checks the sanity of all of the files needed at startup. This includes the boot, app, config and others. If any of them are corrupt and will prevent your system from restarting correctly, WombatOAM will raise an alarm.
Conclusion
This walkthrough shows how WombatOAM collects many metrics, notifications and alarms from managed Erlang nodes. The dashboard helps to visualise this information, with graphs that can be placed on top of each other, and notifications and alarms that can be filtered. When the granularity of the collected information is not enough, you can zoom in and use Live Metrics to see the value of metrics at each second, or the explorer services to online debug your system.
WombatOAM monitors the managed nodes for signs of possible future problems – processes having long message queues, having too many ETS tables, reaching the process limit, filling the atom table, the Erlang node being down, and so forth – and generates alarms from these. It also generates notifications for events that happen within a node, such as commands typed in the Erlang Shell, modules that were loaded, and processes that crashed, thereby giving a history of events on the node. Alarms and error log entries raised by the application will also appear as alarms and error notifications in WombatOAM. All are useful to improve your system by pointing out the weakest part, and then Services can help you to further narrow the case. Also, when there is an on-going outage Services will help you to recover from it immediately.
While Services allow you to inspect and change your system, metrics, alarms and notifications are useful both for detecting early signs of errors that might cause future outages, and investigating past incidents so that you can make sure they don't happen again.
What's next
WombatOAM has a plugin system that lets you write your own plugins, which can collect metrics, notifications and alarms specific to your business logic, and provide new services best fitting to your daily routine. For example, if an application has its own API for serving metrics, a plugin can use this API and provide the metric values to WombatOAM. Or if the user wants to generate a notification each time a certain function is called, a plugin can subscribe to calls of this function and generate the appropriate notifications.
WombatOAM has integration capabilities with other OAM systems, meaning that the information collected by WombatOAM can be pushed into these tools. Supported OAM systems include Graphite, Grafana, Cacti, Graylog, Splunk, Zabbix, Datadog, Logstash, Nagios, AppDynamics and PagerDuty, and because WombatOAM exposes the collected information via its REST API, integration with other OAM systems is also possible. If you already use OAM systems, then hooking WombatOAM into your existing infrastructure is a logical next step, since it would allow you to view the new information via the usual channels.
After a few days of having a system monitored by WombatOAM, it is worth analysing the information collected:
- Look at the active alarms and try to uncover their reasons. Do the same with notifications and cleared alarms.
- Look at the error and warnings notifications, including crash logs.
- Go through the metrics to see if there is anything suspicious, such as strange spikes in memory metrics and the message queue length metric. Going through the metrics will also help to establish a baseline level for them, so that anomalies can be spotted in the future.
- Check the Process notification metrics, such as Busy port and Busy dist port. Numbers significantly higher than 0 indicate possible performance problems.
You may be surprised at what you discover.