Integration with third-party tools
WombatOAM can integrate with third-party OAM tools such as:
- Graphite, Grafana, Cacti, InfluxDB, Amazon Cloudwatch and Honeycomb for metrics;
- Graylog for notifications;
- AppDynamics, Splunk and Zabbix for metrics and notifications;
- Nagios, Slack, Webex Teams and PagerDuty for alarms;
- Logstash and Datadog for metrics, notifications and alarms.
Integration with Cacti, Zabbix and Nagios is done through PyWombat, a Python interface for WombatOAM.
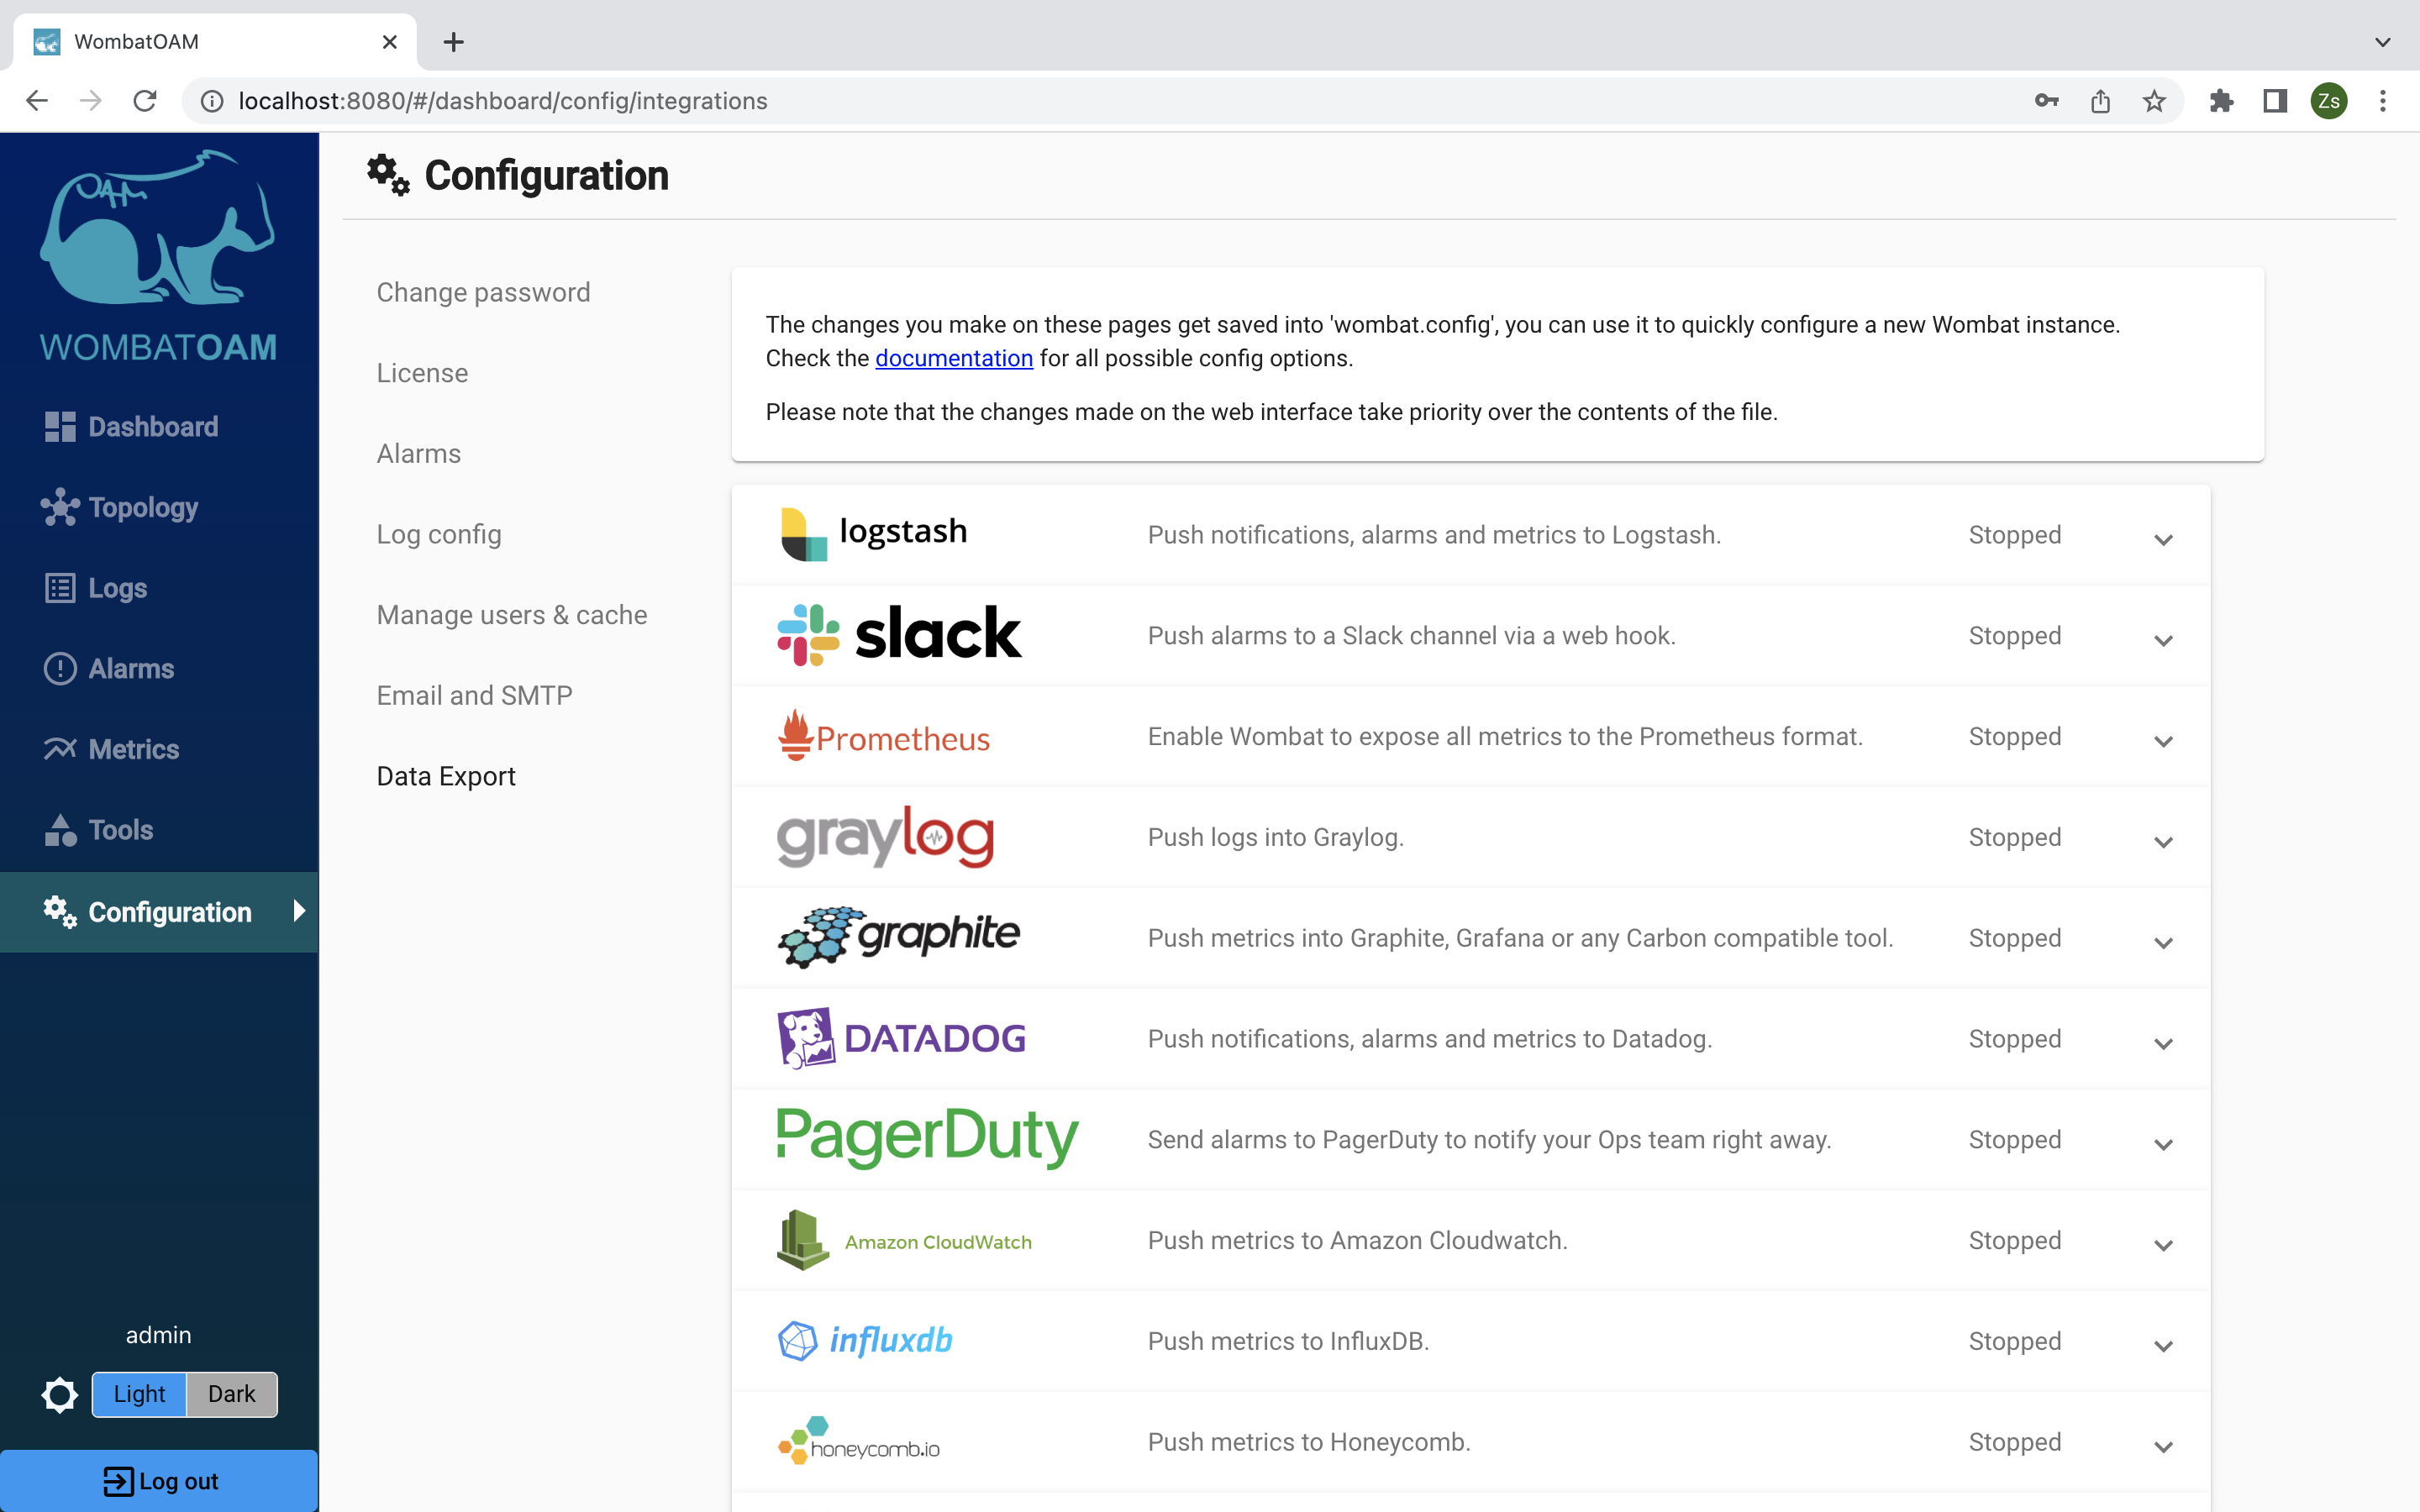
The following integrations can be configured directly from the GUI: Slack, Graphite, Grafana, Graylog, AppDynamics, PagerDuty, Logstash, Amazon Cloudwatch, InfluxDB, Honeycomb, Honeycomb, Webex Teams and Datadog.
On the Configration page, under Data Export, you can configure the available integrations.
PyWombat
PyWombat is a Python interface for WombatOAM, and is required for integration with Cacti and Nagios.
Prerequisites
Python 3 and the setuptools package for Python.
The following command installs these prerequisites on Debian Linux:
1 | |
Installing the PyWombat package
The PyWombat package is shipped with WombatOAM or get it here
To install the PyWombat package:
- extract the
pywombat.tar.gzarchive:
1 | |
- Change to directory of the extracted archive, then run the following:
1 | |
To make sure that the installation has succeeded, you should see this at the end of the output.
1 2 3 4 5 6 7 8 9 | |
The commands wombat_cli, wombat_nagioscfg and wombat_check will be
installed in /usr/local/bin(on Debian).
For information on using the wombat_cli command, run wombat_cli --help:
1 2 3 4 5 6 7 8 9 10 11 12 13 | |
Use tags for narrowing down the set of metrics, notifications and alarms pushed to integrations using PyWombat. You can change the active tags set for the user that is used by PyWombat.
Integration with Cacti
Cacti is an open-source web-based tool using RRDTool as its backend for data storage and graphing. Integrating WombatOAM with Cacti requires PyWombat – see "PyWombat" above.
The wombat_cli script
This script provides basic command-line access to the REST API of WombatOAM.
To initiate a session, enter the following (substituting WombatOAM's IP address
after host):
1 | |
If you're executing Wombat in a Docker container, you need to execute the
wombat_cli inside the Docker container. Please see the
instructions on starting PyWombat commands in Docker in the
Docker chapter.
The following is a sample session to discover nodes and metrics provided by them:
1 2 3 4 5 6 7 8 9 10 11 12 13 14 15 16 17 18 19 20 21 22 23 24 25 26 27 28 29 30 31 32 33 34 35 36 37 38 39 40 41 42 43 44 45 46 47 48 49 50 | |
Example for outputting data in a format expected by Cacti:
1 2 3 | |
Collecting data with Cacti
See also the "How to"" section of the Cacti documentation.
1. Adding a new data input method
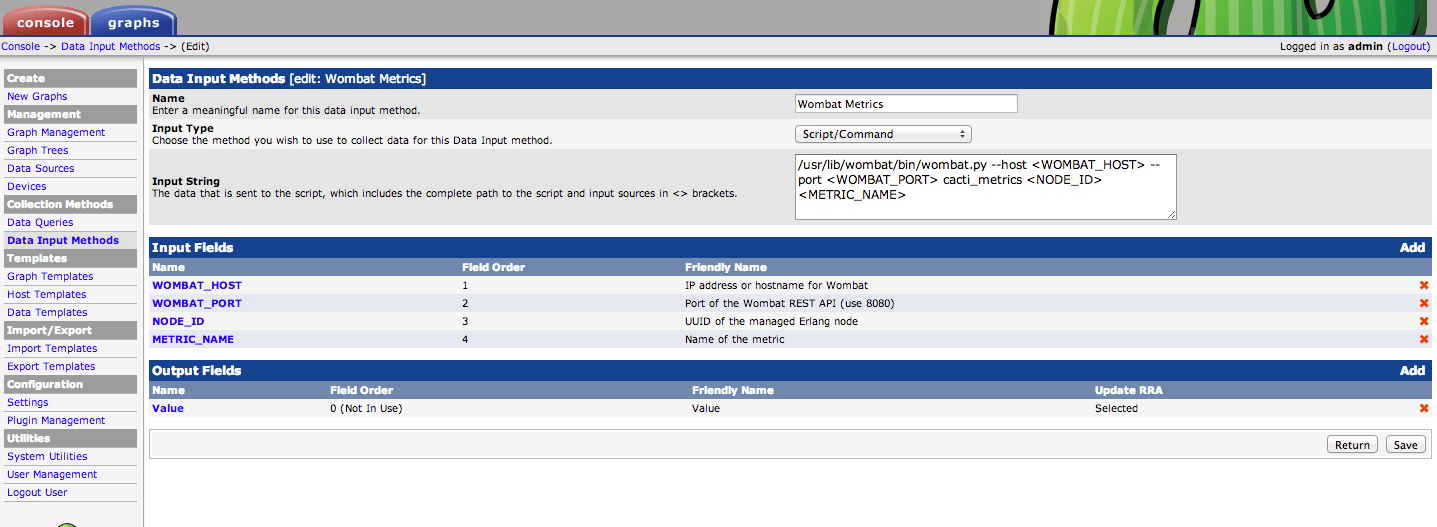
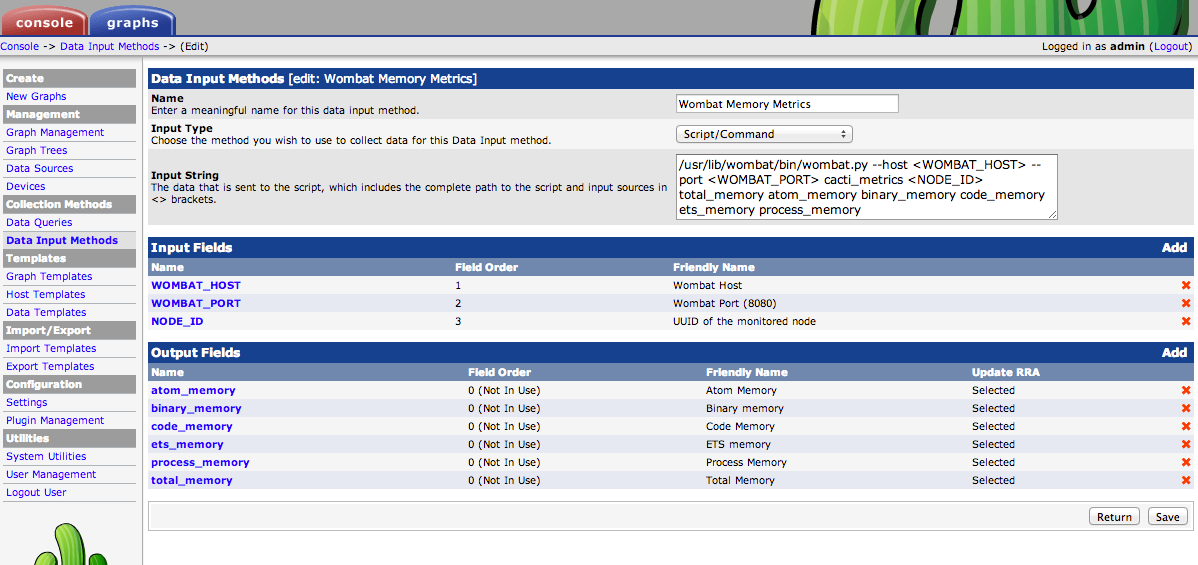
The first and the only WombatOAM-specific step of configuring Cacti: Select Data Input Methods in the menu on the left of the Cacti web console, then click Add and select Script/Command as Input Type.
Cacti needs the exact path to the wombat_cli script, and it must be
executable by the user running Cacti. The command can be parametrised by
using input fields in <>-brackets. The script output must either be a
single value (numeric) or a space-separated list of Key: Value pairs.
The screenshot below shows a fairly general setup for retrieving any single metric for a managed node from WombatOAM:
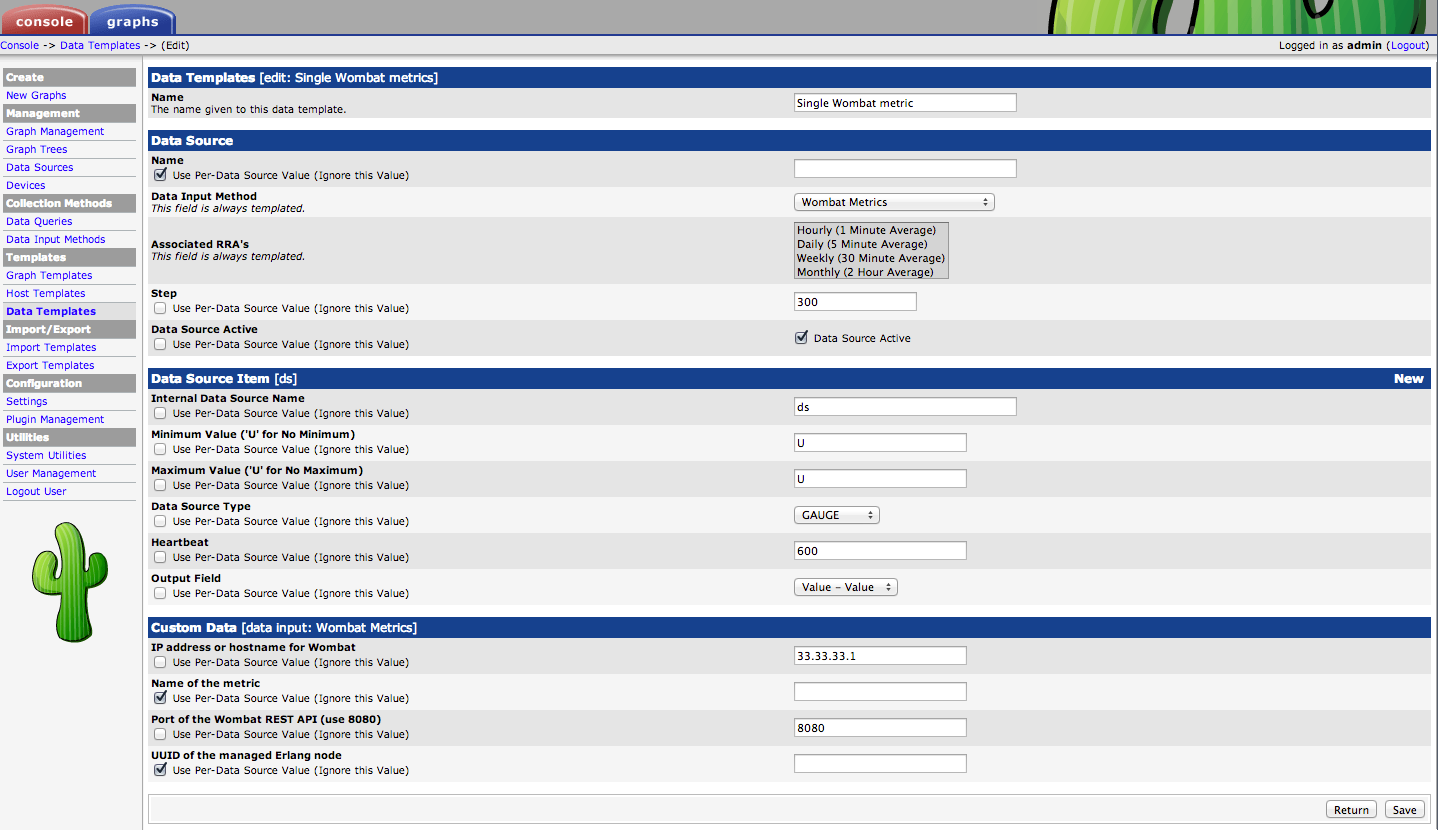
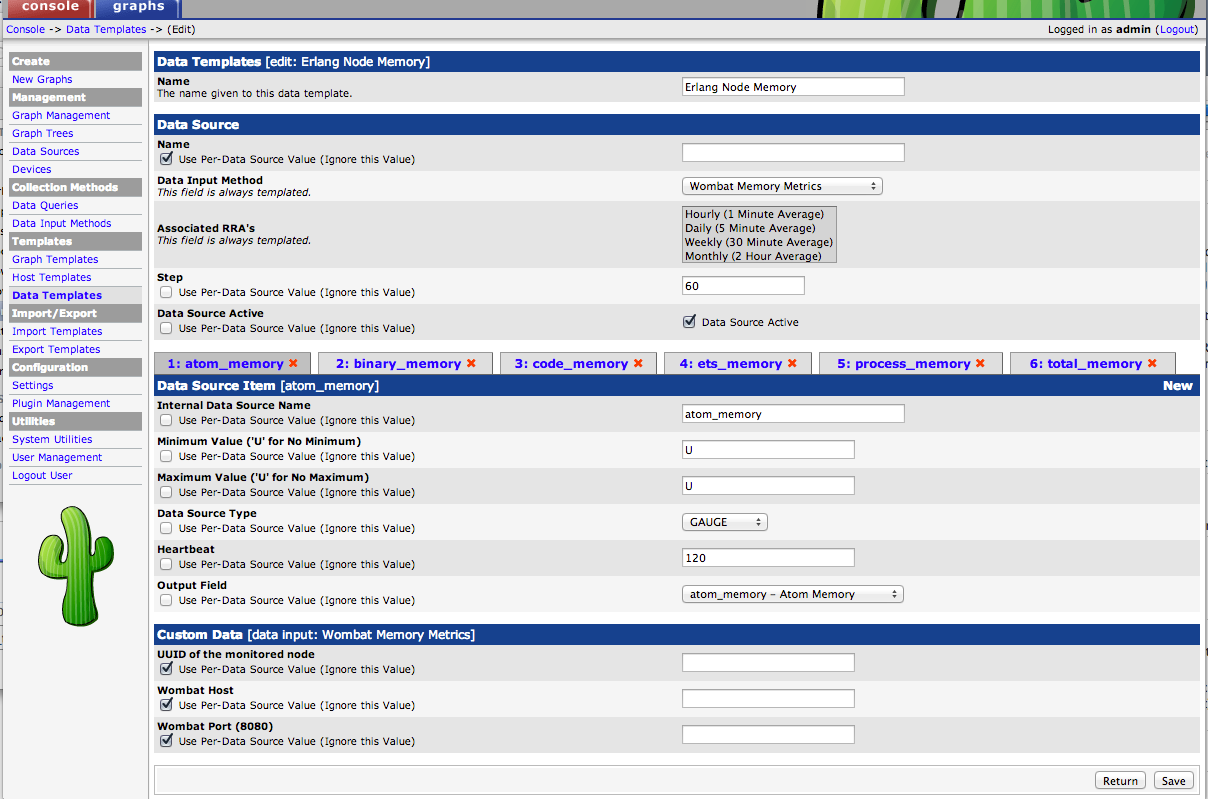
2. Create a new data template
This step is not strictly necessary, but speeds up adding new data sources later.
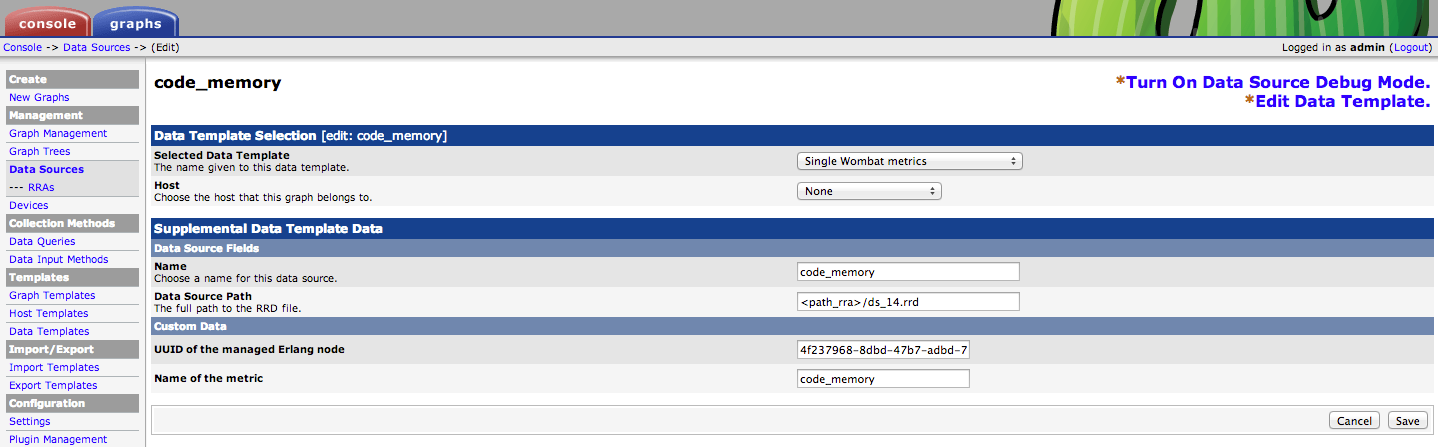
3. Adding data sources
4. A more complex example -- collecting several metrics in one step
First, we'll need an input source with multiple fields:
Then a template:
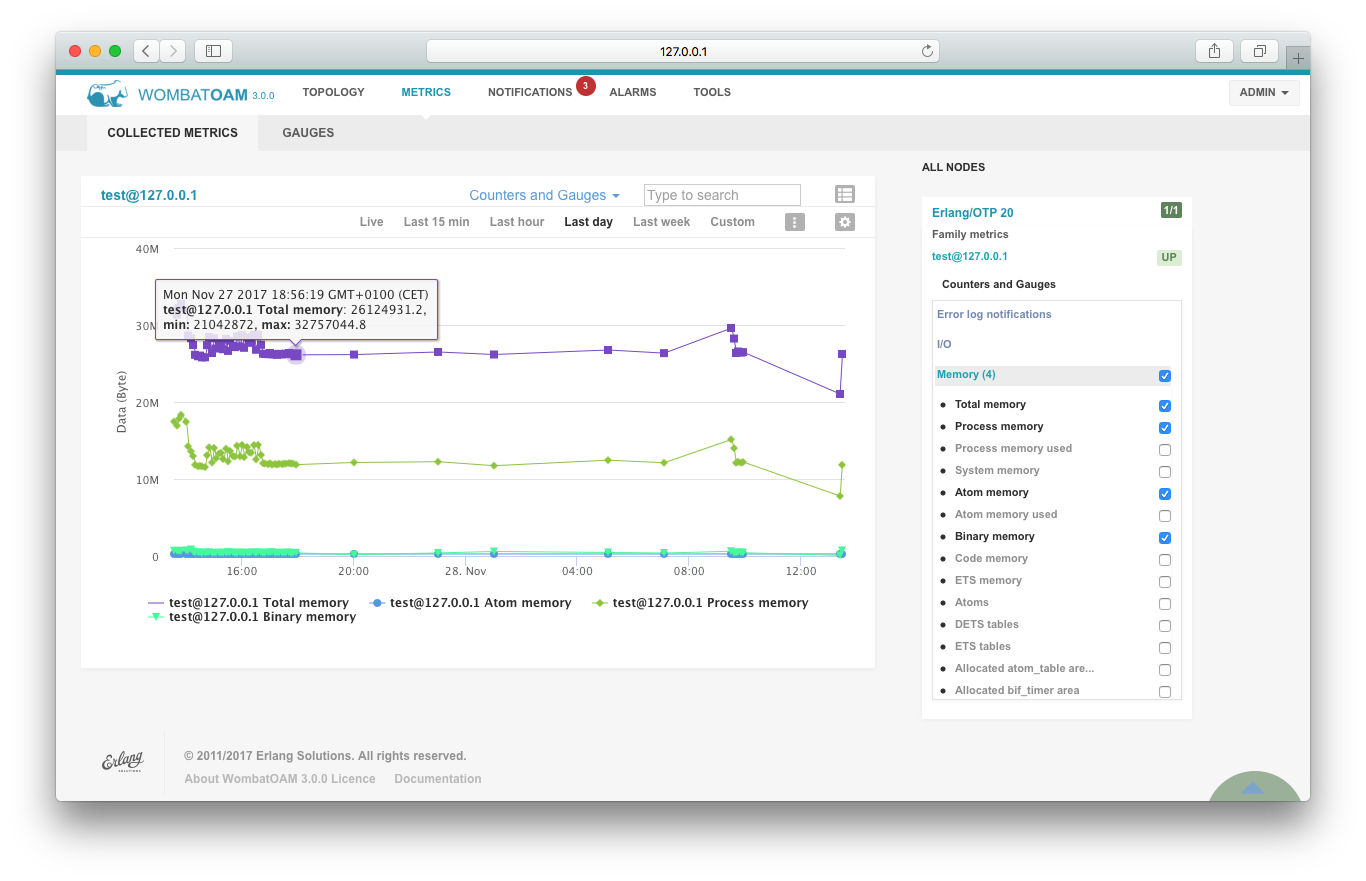
The graph in WombatOAM:
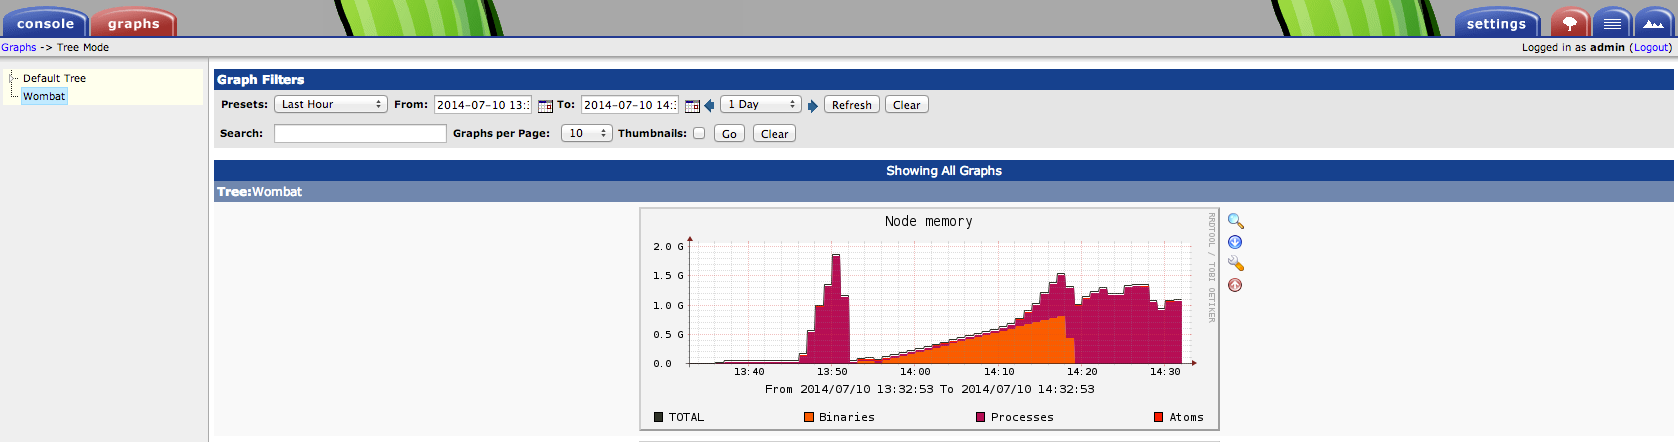
The graph in Cacti:
Integration with Nagios
Nagios is a system and network monitoring application. Integrating WombatOAM with Nagios requires PyWombat – see "PyWombat" above.
Configuration
-
Generate configuration for Nagios:
$ wombat_nagioscfg --host <WOMBAT-HOST> --port <WOMBAT-PORT> > wombat.cfgSpecify the
-soption to use SSL. If you're executing Wombat in a Docker container, you need to execute thewombat_nagioscfginside the Docker container. Please see the instructions on starting PyWombat commands in Docker in the Docker chapter. -
Inspect the generated
wombat.cfgand modify it if necessary, especially if you're executing Wombat in a Docker container, because in that case thewombat_checkcommand will not be available and have to usedocker exec(see the instructions on starting PyWombat commands in Docker in the Docker chapter). -
Put
wombat.cfgin the directory where your Nagios configuration files are stored (for example,etc/nagios/conf.d/on Debian). -
Restart Nagios (
service restart nagios3or/etc/init.d/nagios3 restart).
Troubleshooting
If you experience problems, try the following:
-
Check if the installation of Pywombat is correct: the commands
wombat_checkandwombat_nagioscfgshould be in the PATH. -
Check if WombatOAM can be accessed. Make sure to use the correct setting for connecting.
 1
 2
 3
 4
 5
 6
 7
 8
 9
10
11
12
13
14
15
16
17
18
19
$ wombat_check --help usage: wombat_check [-h] [-H HOST] [-p PORT] [-s] [--user USER] [--password PASSWORD] Script to access to WombatOAM functionality optional arguments: -h, --help show this help message and exit -H HOST, --host HOST -p PORT, --port PORT -s, --https --user USER --password PASSWORD $ wombat_check --host badhost check_wombat WOMBAT CRITICAL Error getting data from WombatOAM at https://badhost:8443/api/help/about. Reason: <pre error [Errno -2] Name or service not known> $ wombat_check --https --host goodhost check_wombat WOMBAT OK pre-1.5.1 - 0 alarm(s) present - https://goodhost:8443/ -
Make sure that Nagios has restarted and has loaded the new configuration file.
Integration with Graphite
WombatOAM can push all collected metrics into Graphite via UDP.
After installing Graphite, you need to modify carbon.conf to listen for UDP
packages:
1 2 3 | |
The Graphite web dashboard listens on port 8002 by default, so open
http://localhost:8002/.
Before trying to view WombatOAM data in Graphite, test that it actually captures UDP data by trying to send some UDP packages. You can use either of the following methods (socat is a more complex variant of netcat that is larger and more flexible):
1 2 3 4 5 6 7 8 | |
Then add the following entries to wombat.config:
1 2 3 4 | |
Provide a list of tags to narrow down the set of metrics
pushed to Graphite or use all to switch off filtering. If the tags config
option is not set, all metrics will be pushed to Graphite.
Integration with Datadog
WombatOAM can push all collected metrics, notifications and alarms into Datadog via UDP. WombatOAM alarms are forwarded to Datadog both as events and service checks. WombatOAM will push one event and one service check message for each raised alarm and another pair for each cleared alarm.
The installation of Datadog will add a local agent listining at UDP port localhost:8125. This agent will send to your personal Dashboard at the Datadog web site.
Before trying to view WombatOAM data in Datadog, test that it actually captures UDP data by trying to send some UDP packages. You can use either of the following methods (socat is a more complex variant of netcat that is larger and more flexible):
1 2 3 4 5 6 7 8 | |
Then add the following entries to wombat.config:
1 2 3 4 5 6 7 | |
The environment will act as a tag, and the metric will be tagged either from prod or dev. (By default the dev is set).
You can disable sending metrics, notifications or alarms to Datadog by setting
the corresponding config option to false.
Provide a list of tags to narrow down the set of metrics,
notifications and alarms pushed to DataDog or use all to switch off filtering.
Alarm events
All events have the title "Wombat error"/"Wombat warning" and the following tags:
node: erlang node namehostnamealarm_id: the type of alarmunique_alarm_id: an integer or slug that uniquely identifies the raised and cleared pairs of a given alarm instance (eg. on the same node clearingdisk_almost_fullfor/tmpwon't clear the raised alarm for/home)presence:neworclearseverity: WombatOAM alarm severity (same as lager severity levels)origin: WombatOAM subsystem that triggered the alarm
There is a separate event for each cleared alarm with alert_type: success
Alarm service checks
For all alarms, service check name is wombat.alarm and have the same tags as
the events
Monitoring WombatOAM alarms
- As an example the following Custom Monitor can be set up:
1 2 | |
- It will have a separate trigger for each
unique_alarm_id. alarm_idwould not be strictly needed, it is only included for readable identification of the alarm type
Integration with Logstash
WombatOAM can push notifications, alarms and metrics to Logstash in JSON format via UDP.
First, configure Logstash to be prepared for receiving data pushed by WombatOAM. Note that the Logstash's config file should have the following content in its input block to parse WombatOAM's messages.
1 2 3 4 | |
Then add the following entries to wombat.config:
1 2 3 4 5 6 | |
You can disable sending metrics, notifications or alarms to Logstash by setting
the corresponding config option to false.
Provide a list of tags to narrow the set of metrics, notifications
and alarms pushed to Logstash or use all to switch off filtering.
Integration with Graylog
WombatOAM can push all collected logs into Graylog via UDP.
The installation of Graylog will add a local server listening by default for UDP GELF format messages at localhost:12201 and syslogs plain text at localhost:514. The Graylog admin web is accessible at localhost:9000.
Before trying to view WombatOAM data in Graylog, test that it actually captures UDP data by trying to send some UDP packages. You can use either of the following methods (socat is a more complex variant of netcat that is larger and more flexible):
1 2 3 4 5 6 7 8 9 | |
Then add the following entries to wombat.config:
1 2 3 4 5 6 7 8 9 10 11 | |
host and port are mandatory, the rest of the config keys are optional.
- inet_family will tell WombatOAM if it should try to resolve host to an IPv4
or IPv6 address.
- level describes the lowest severity level for which logs should be forwarded
to Graylog.
- additional_fields contains a key-value list that can be appended to each
GELF message as additional fields.
- send_notifications a list of tags to further narrow the set of
notifications pushed to Graylog or use all to switch off this optional
filtering.
Integration with Splunk
Splunk is a data collection, indexing and visualization engine for operational intelligence. WombatOAM ships with an add-on for integrating with Splunk.
Installing the Splunk add-on
The Splunk add-on wombat.spl is located in WombatOAM's integrations directory.
To install the add-on, consult the following page of the Splunk documentation:
https://docs.splunk.com/Documentation/PCI/5.0.0/Install/InstallTechnologyAdd-ons
Please make sure that you choosed the correct version of your Splunk. This guide is made for Splunk Enterprise 5.0.0.
Follow the procedure under "Add a technology add-on from a local file";
select and upload wombat.spl.
This Splunk add-on facilitates defines a new data source type for forwarding metrics and notifications collected by WombatOAM to Splunk.
To set up data forwarding in Splunk:
-
On the top menu bar select Settings, select Add Data.
-
Choose the monitor option, then WombatOAM.
-
Fill in the form with the required information about the WombatOAM server.
Splunk will fetch data using the REST API of WombatOAM. It therefore needs a valid user name and password if authentication is enabled in WombatOAM.
- name: whatever you would like to call it
- Wombat host:: usually
localhost - Port: usually
8080for HTTP - Check the Security if you would like to use HTTPS. Please keep in mind, first you need to configure Wombat to operate over HTTPS. Your ports may also change
- Check the box next to Authentication
- User name: User name for accessing Wombat
- Password Password of the Wombat user
- Click on More settings and set the Interval to
60as Wombat collects data in every one minute - Choose the destionation Index. Default is main.
-
Click Next to finish the setup process.
The data source will forward all notifications and metrics to Splunk that are tagged with any of the active tags set for the user.
Alarms cannot be directly represented in Splunk, but each state transition of an alarm generates a notification too, so it is possible to reconstruct the active alarm list from the available information.
Notifications
WombatOAM notifications will have the wombat_notification sourcetype. A
sample event may look like this:
1 2 3 4 5 6 7 8 9 10 11 12 | |
Metrics
WombatOAM metrics will have the wombat_metric sourcetype. A sample
event may look like this:
1 2 3 4 5 6 7 8 9 10 11 12 13 14 | |
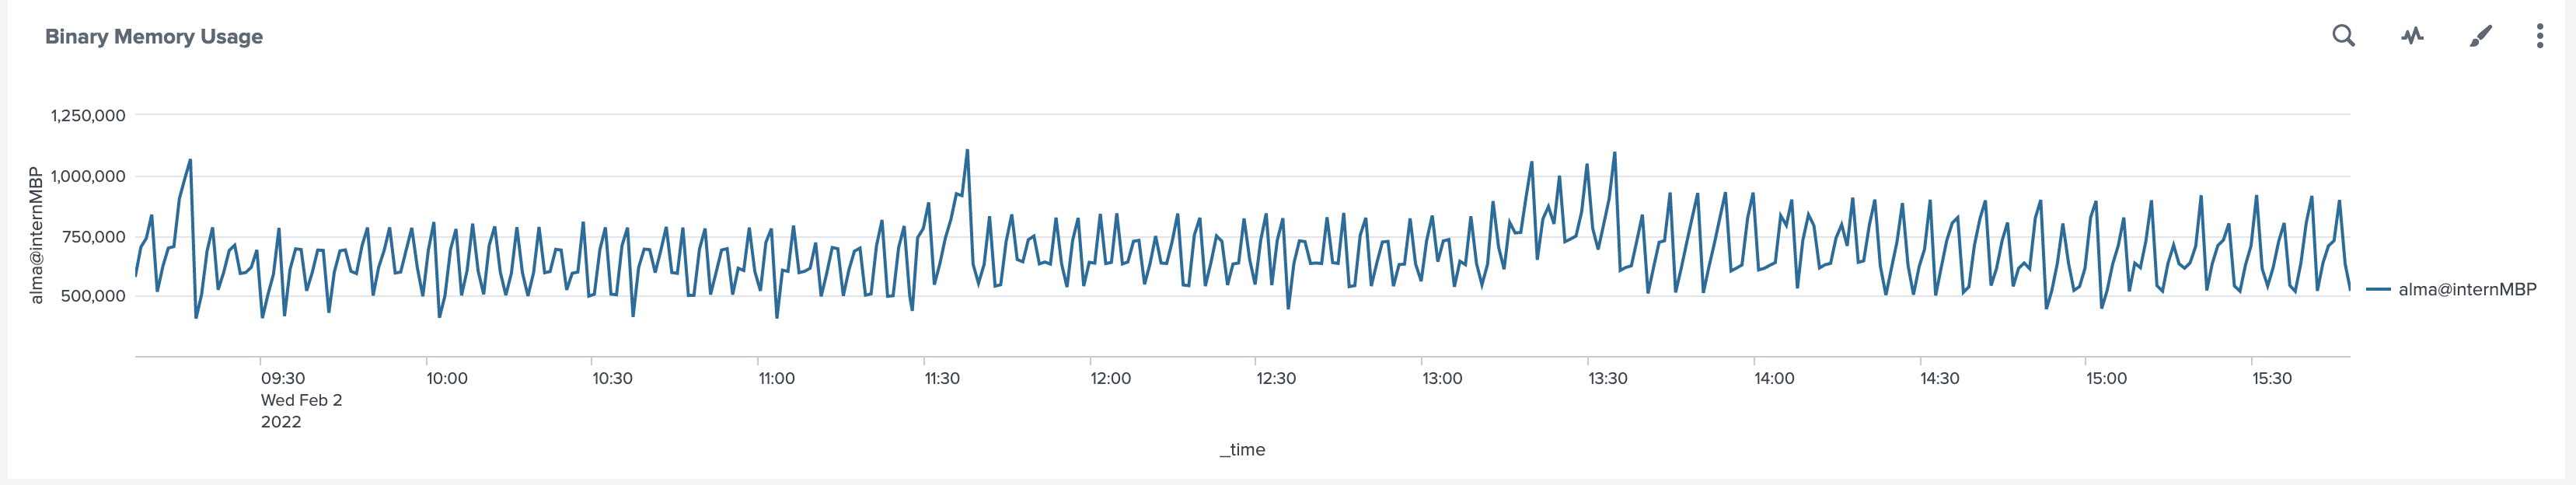
It is also possible to chart a metric's value with Splunk. For example, the following search will return you the Binary Memory used by your nodes.
1 | |
You can also visualize theese data by creating a dashboard.
- Go to Search & Reporting
- Dashboard
- In the top right click Create New Dashboard
- Fill in the information, Classic Dashboard will be fine for now
- Click Add Panel, then New, where select Line Chart
- Add the following Search String.
1 | |
Integration with PagerDuty
PagerDuty is an alarm aggregation and dispatching service for system administrators and support teams. WombatOAM can send notifications of alarms that are raised on the monitored nodes to PagerDuty. The alarms can then be forwarded to the user, using one of the following two PagerDuty services:
- Email: An email is sent to an address checked by PagerDuty. If a mail is found describing an alarm, the notification is forwarded.
- PagerDuty API: Using the PagerDuty API directly, REST calls are sent to a configured URL.
Use tags for configuring alarm subscriptions.
Set the value all to send all alarms, or provide a list of tags (including
custom tags) to send only those alarms that are tagged with any of the listed
tags.
The following example configuration defines two rules:
- All major and critical alarms should be forwarded to both services to trigger incidents with high priority;
- All alarms related to any of the two production nodes should be sent as email to the given email address.
1 2 3 4 5 6 7 8 9 10 11 12 13 14 15 16 17 18 19 20 21 22 23 24 25 | |
Currently, there are two ways to send alarms to the PagerDuty service: email and using the PagerDuty API.
Note that using the email configuration requires a running SMTP server. Using the API functionality instead is recommended.
Emails to PagerDuty are configured in the section pagerduty_mail with the
following options:
address: The integration email address created in PagerDutysender: The address of the sendersmtp_opts: A proplist for configuring the SMTP server
PagerDuty API
Using the PagerDuty API is configured in the pagerduty_api section. The
accepted parameters for using the PagerDuty API are as follows:
address: URL of the PagerDuty APIservice_key: The service key generated when the PagerDuty service was createdclient: A string describing the service sending alarms
Integration with Zabbix
Setting up Zabbix for WombatOAM
1. Install ZabbixAPI
First you need to download and install Zabbix API:
1 | |
2. Install pyWombat
Integrating WombatOAM with Zabbix requires PyWombat – Download it here. and follow the instructions here: "PyWombat".
3. Create symlink in the External scripts' folder
On Zabbix server create a symlink in the directory where Zabbix external checks are
stored (by default: /usr/lib/zabbix/externalchecks, see also the
documentation).
The symlink's name has to be wombat_getter and it points to the
wombat_zabbixplugin executable which was installed with pywombat in the
previous step.
1 | |
Check that execution and read permissions for wombat_getter are allowed for the user who runs Zabbix server.
Note that the script uses zabbix_sender
which has to be installed on the server.
4. Import the given template file in Zabbix
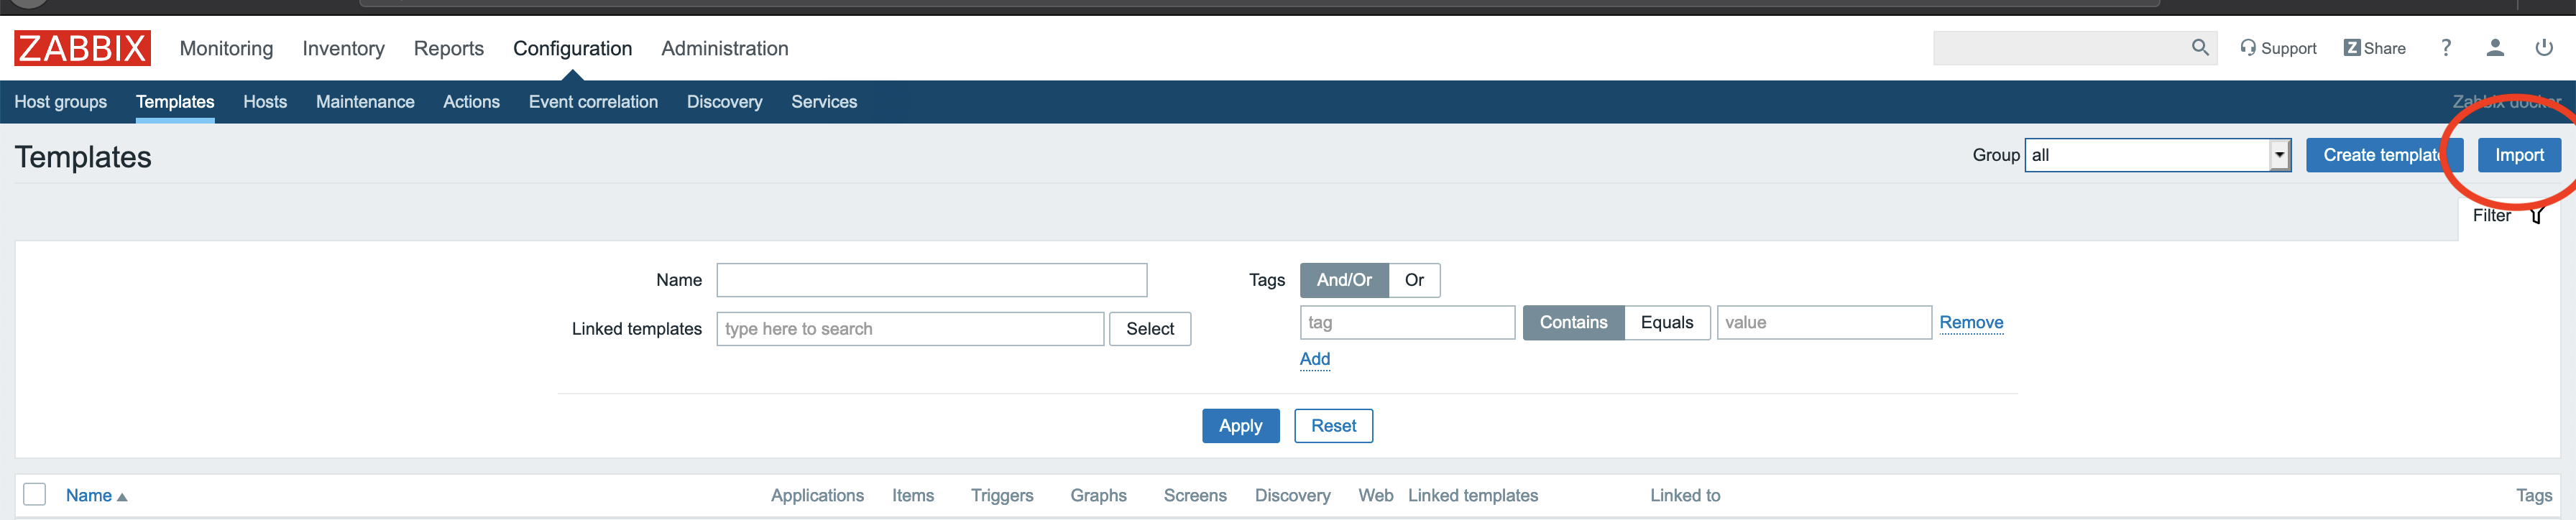
In the menu of the Zabbix web interface go to Configuration -> Templates, then
click Import. Click on Choose file and select the Zabbix template file
(zbx_wombat_template.xml) that
can be found in the pywombat sources under doc/zabbix-integration.
Click import.
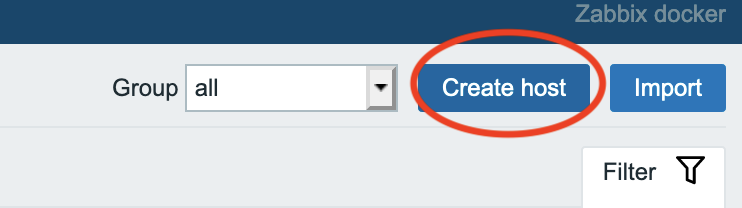
5. Create a new host
In the menu of the Zabbix web interface go to Configuration -> Hosts, then click
Create host.
The host needs to be exactly in one group which corresponds with the
host name. For example you can use wombat as host name and use wombat as group name, the visible
name can be something generic, such as WombatOAM general.
we only need the host name and host group part. you can ignore all the rest.
Before clicking on 'Add', you need to add this host to the template that you previously added.
Locate the menu as shown in this screenshot.
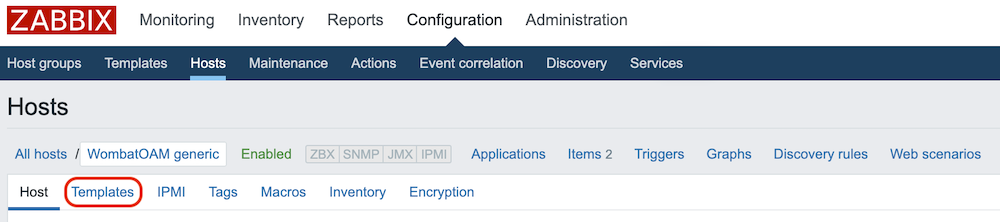
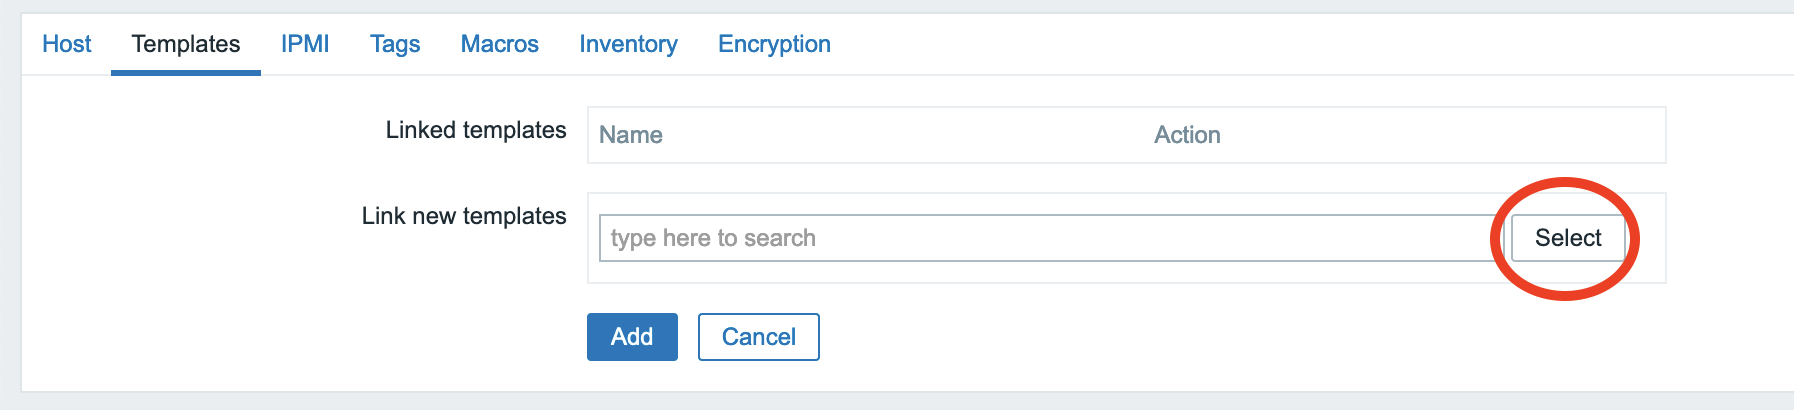
In the popup window select our template, then click on the "Add on Templates" tab. After setting these up, go back to Host tab and click Add.
6. Setup wombat_data_getter item
Now you have a new host with two items, called wombat_data_getter and
wombat_logger_for_data_getter. wombat_data_getter calls frequently
wombat_zabbixplugin, which was referenced in step 3. It has the following
parameters with the default values:
WHOST127.0.0.1: WombatOAM addressWPORT8080: WombatOAM portWUSERadmin: WombatOAM userWPASSWORDadmin: WombatOAM passwordZGROUPwombat: Zabbix group that you defined inZSERVERhttp://localhost/: Url of the zabbix web interfaceZUSERAdmin: Zabbix userZPASSWORDzabbix: Zabbix password
If one or more doesn't fit to your configuration, you can add your own: In the menu of the Zabbix web interface go to Configuration -> Hosts, select your new host, and click Macros. Here you can define your values for the above listed macros.
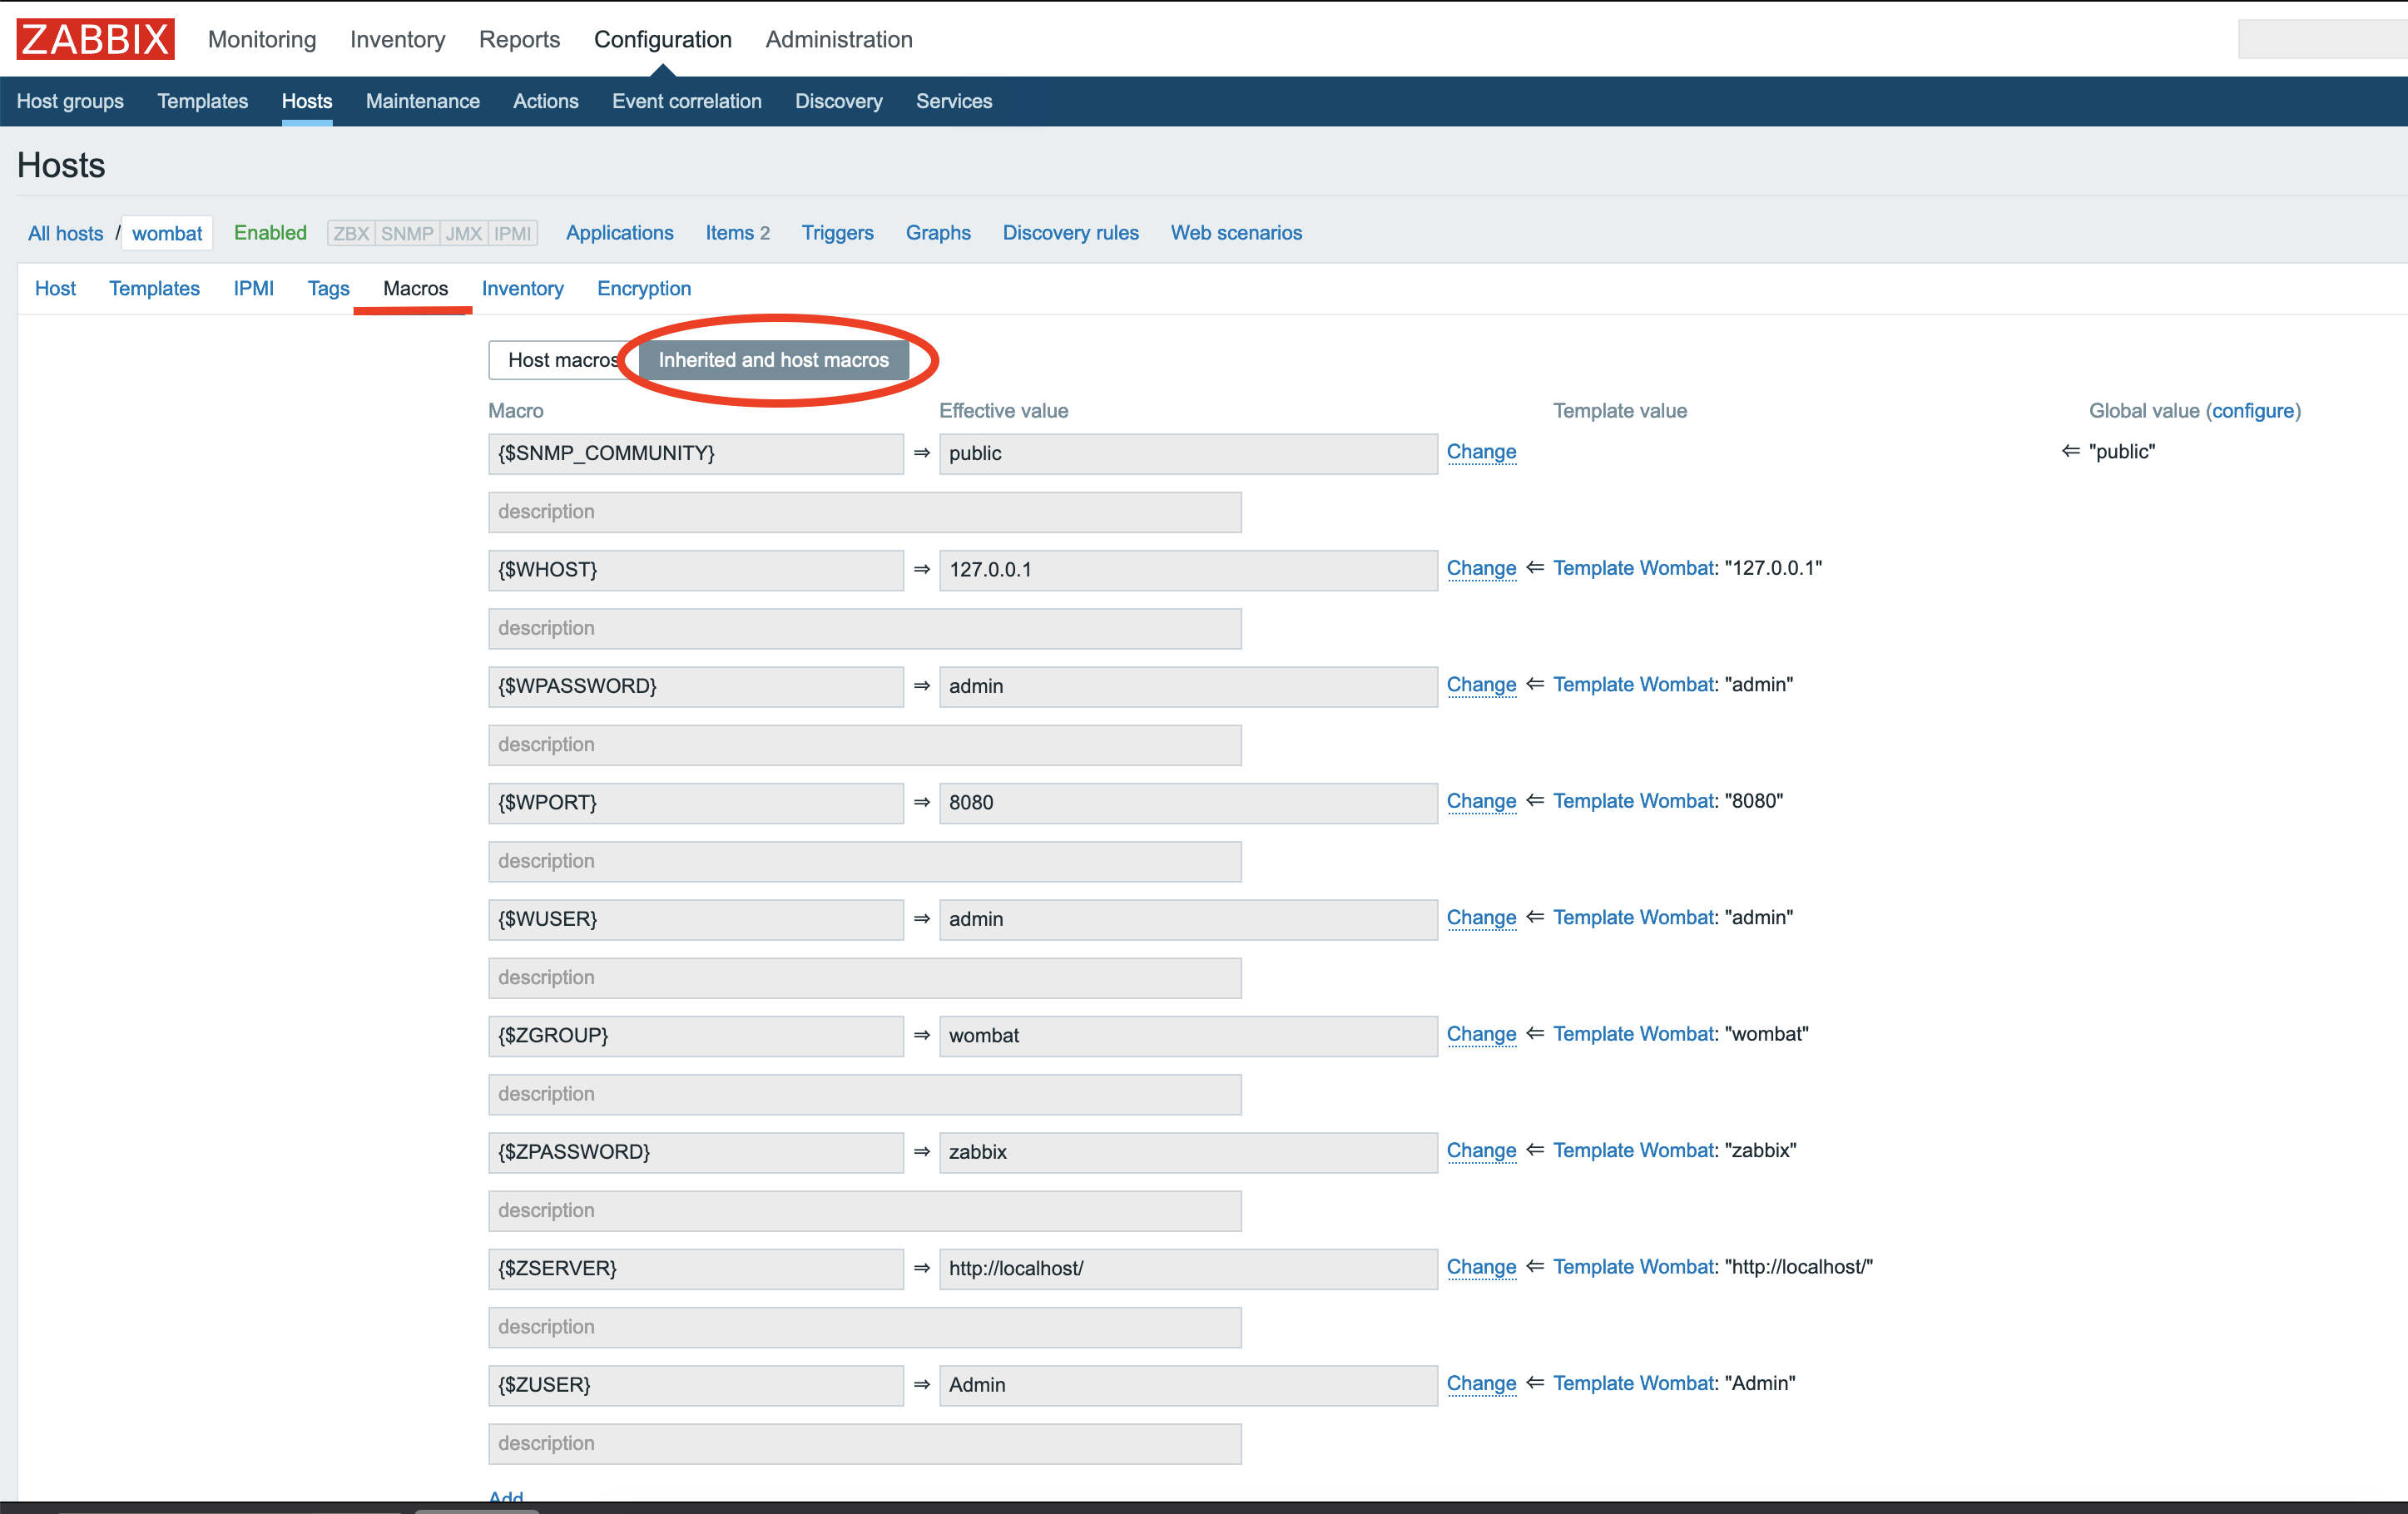
For example type macro {$ZPASSWORD} and value your_password.
Collecting data with Zabbix
After completing the "Setting up Zabbix for WombatOAM" section, you need to set up new hosts which will refer to WombatOAM nodes.
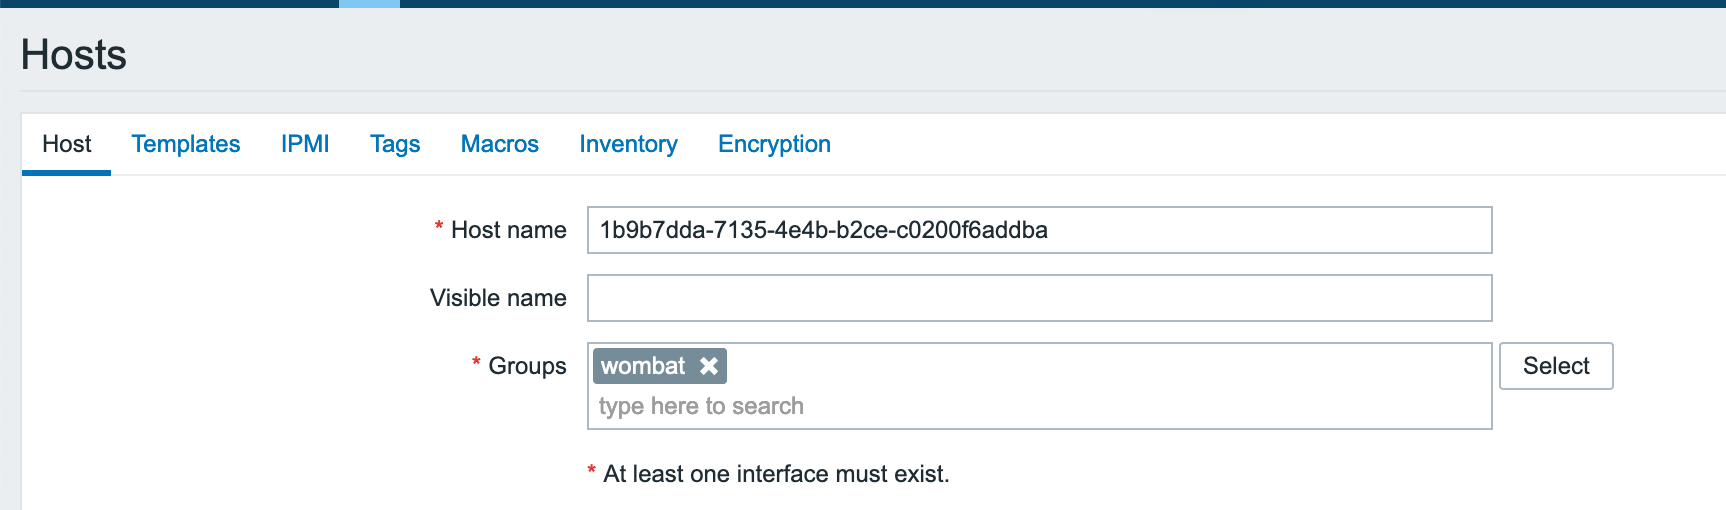
Go to Configuration -> Hosts, then click Create host. The host needs to be in the same host group as the host created in step 3.
The host should have as a name, the node id of the node that you want to monitor
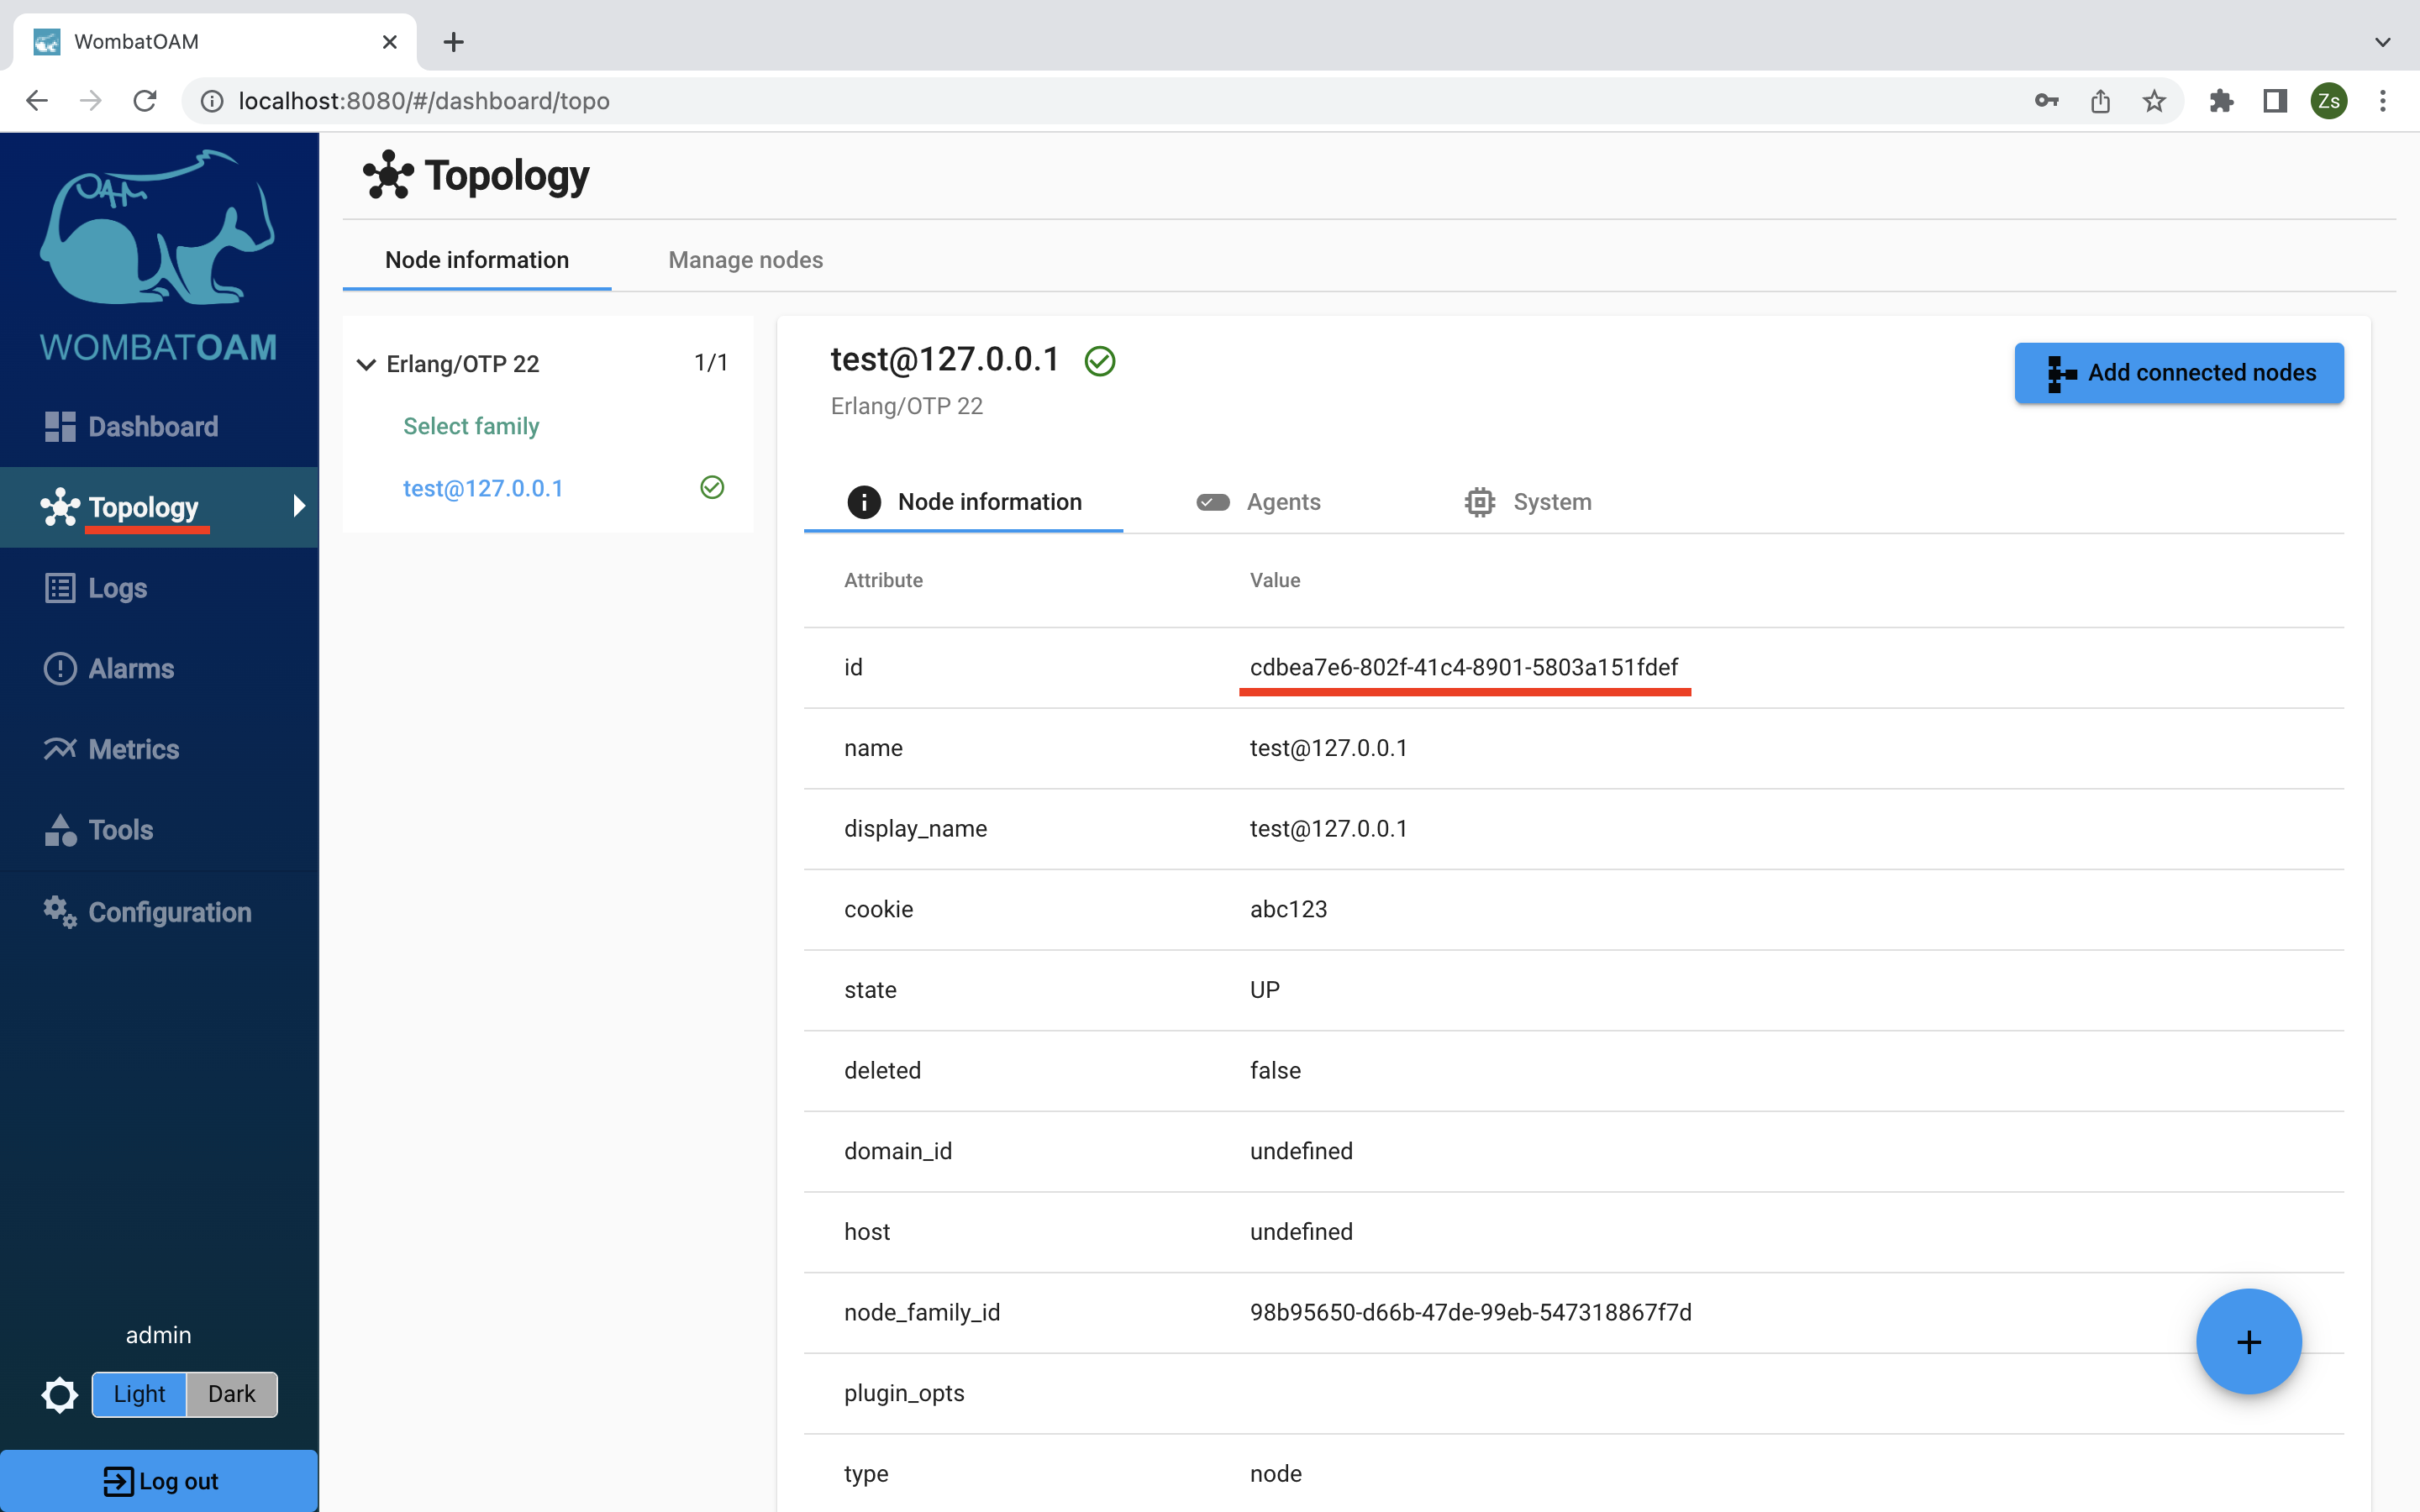
You should now be able to see all the alarms that are generated on that node.
you should repeat the previous step for all the nodes that you wish to monitor in Zabbix.
Integration with AppDynamics
WombatOAM can send metrics and notifications via HTTP to a Simple Machine Agent (SMA) which sends them to the AppDynamics Controller. In wombat.config you must map each Erlang node monitored by Wombat to the Simple Machine Agent associated with it. Below we configured a single Erlang node. You can specify as many as you want in the list.
1 2 3 4 5 6 7 | |
Here is a breakdown of the above.
rabbit@localhost: The Erlang node whose data you want to send to AppDynamics. This is used to lookup the SMA configuration.address: The address of the HTTP server (started by SMA) that Wombat data is sent to.port: The port number of the HTTP server (started by SMA) that Wombat data is sent to. Defaults to 8125 if not supplied.metrics_prefix: The path of every metric sent will begin with this. Defaults to <<"Custom Metrics">> if not supplied.send_metrics: If an incoming metric matches the tag specified here then it is sent to the SMA. To forward all metrics choose all, otherwise Tag where tag is a custom metric. If send_metrics and send_notifications are false then no data for the Erlang Node will be sent to AppDynamics.send_notifications: The same as above.
You have the option to configure a timeout. When no metrics have been received in Wombat in a given interval (defaults to 60 seconds) then all metrics accumulated will be sent to the SMA.
1 | |
To apply the configuration you must restart Wombat. After this open AppDynamics and navigate to "Servers" in the top menu bar. To view metrics click on "Metric Browser" and for notifications click on "Events". The integration was developed against version PRO43 of the AppDynamics Controller.
You can disable sending metrics or notifications to AppDynamics by setting
the corresponding config option to fasle.
Provide a list of tags to narrow the set of metrics and notifications
pushed to AppDynamics or use all to switch off filtering.
Integration with Honeycomb
WombatOAM can push all collected metrics into Honeycomb. Metrics will be sent using the default sample-rate =1 value.
Configuration :
- Dataset: provide the dataset name in Honeycomb in order to send all Wombat metrics to the specified dataset
- Write Key: to send data into Honeycomb,the API key is required.
Integration with Slack
WombatOAM can push alarms to a Slack channel via an incoming web hook in JSON format.
First you need to create an app for your Slack workspace. You can follow Slack's documentation, but you only need to focus on the first three steps:
- Create a Slack app (if you don't have one already) (choose the workspace you want to receive the alarms in)
- Enable Incoming Webhooks
- Create an Incoming Webhook
After the third step, you should have an URL, something like this:
1 | |
Open WombatOAM's web interface, and navigate to Configuration > Data Export > Slack
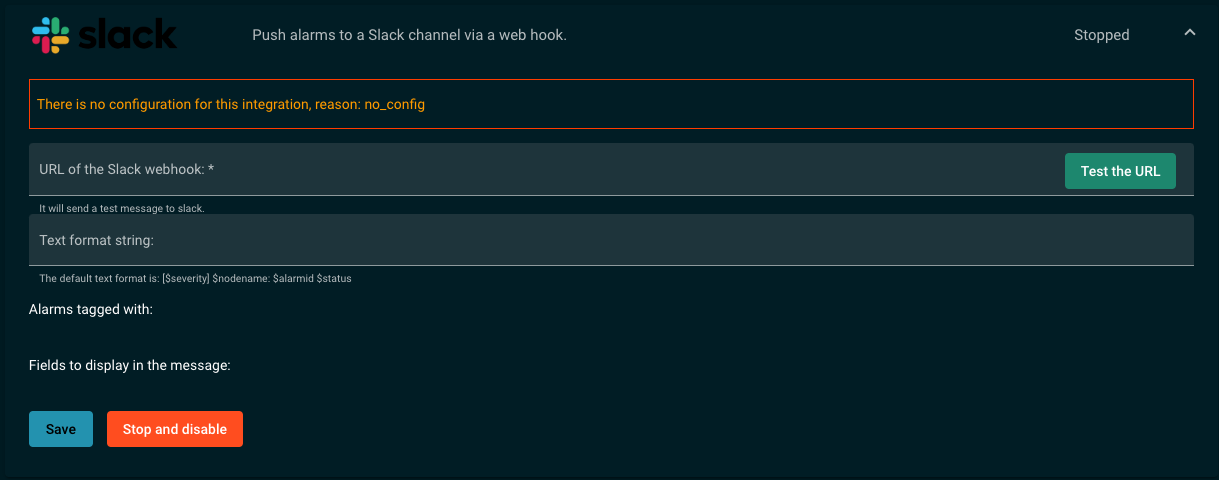
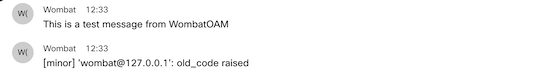
There, you can paste the URL for the webhook, and test it. You should receive
a message in the configured Slack channel: This is a test message from WombatOAM.
After this, you are all set. When an alarm is raised, WombatOAM will send a message to the desired channel.
The example message looks like this in the Slack channel:
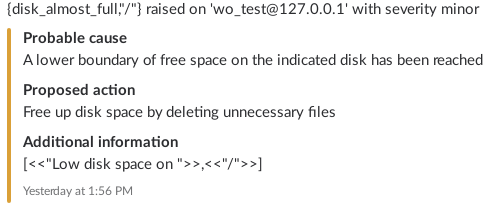
The color of the message is based on the severity of the alarm: red for critical and major alarms, orange for minor, warning or indeterminate alarms, green for cleared alarms.
Configuration
Besides the URL you can provide a format text with the following variables, which are replaced in the actual text message by their values:
$severity: The severity of the alarm (e.g.critical).$alarmid: The alarm ID of the alarm (e.g.disk_capacity_major).$nodename: The name of the node where the alarm was raised (e.g.'wo_test@127.0.0.1').$status: It israisedif the alarm is new orclearedif the alarm is cleared.
The default format is the following: [$severity] $nodename: $alarmid $status
Integration with Amazon Cloudwatch
WombatOAM can push metrics to Amazon Cloudwatch.
There are two ways of setting up the integration. The first one is using a environment variable and the second one is filling the necessary textboxes.
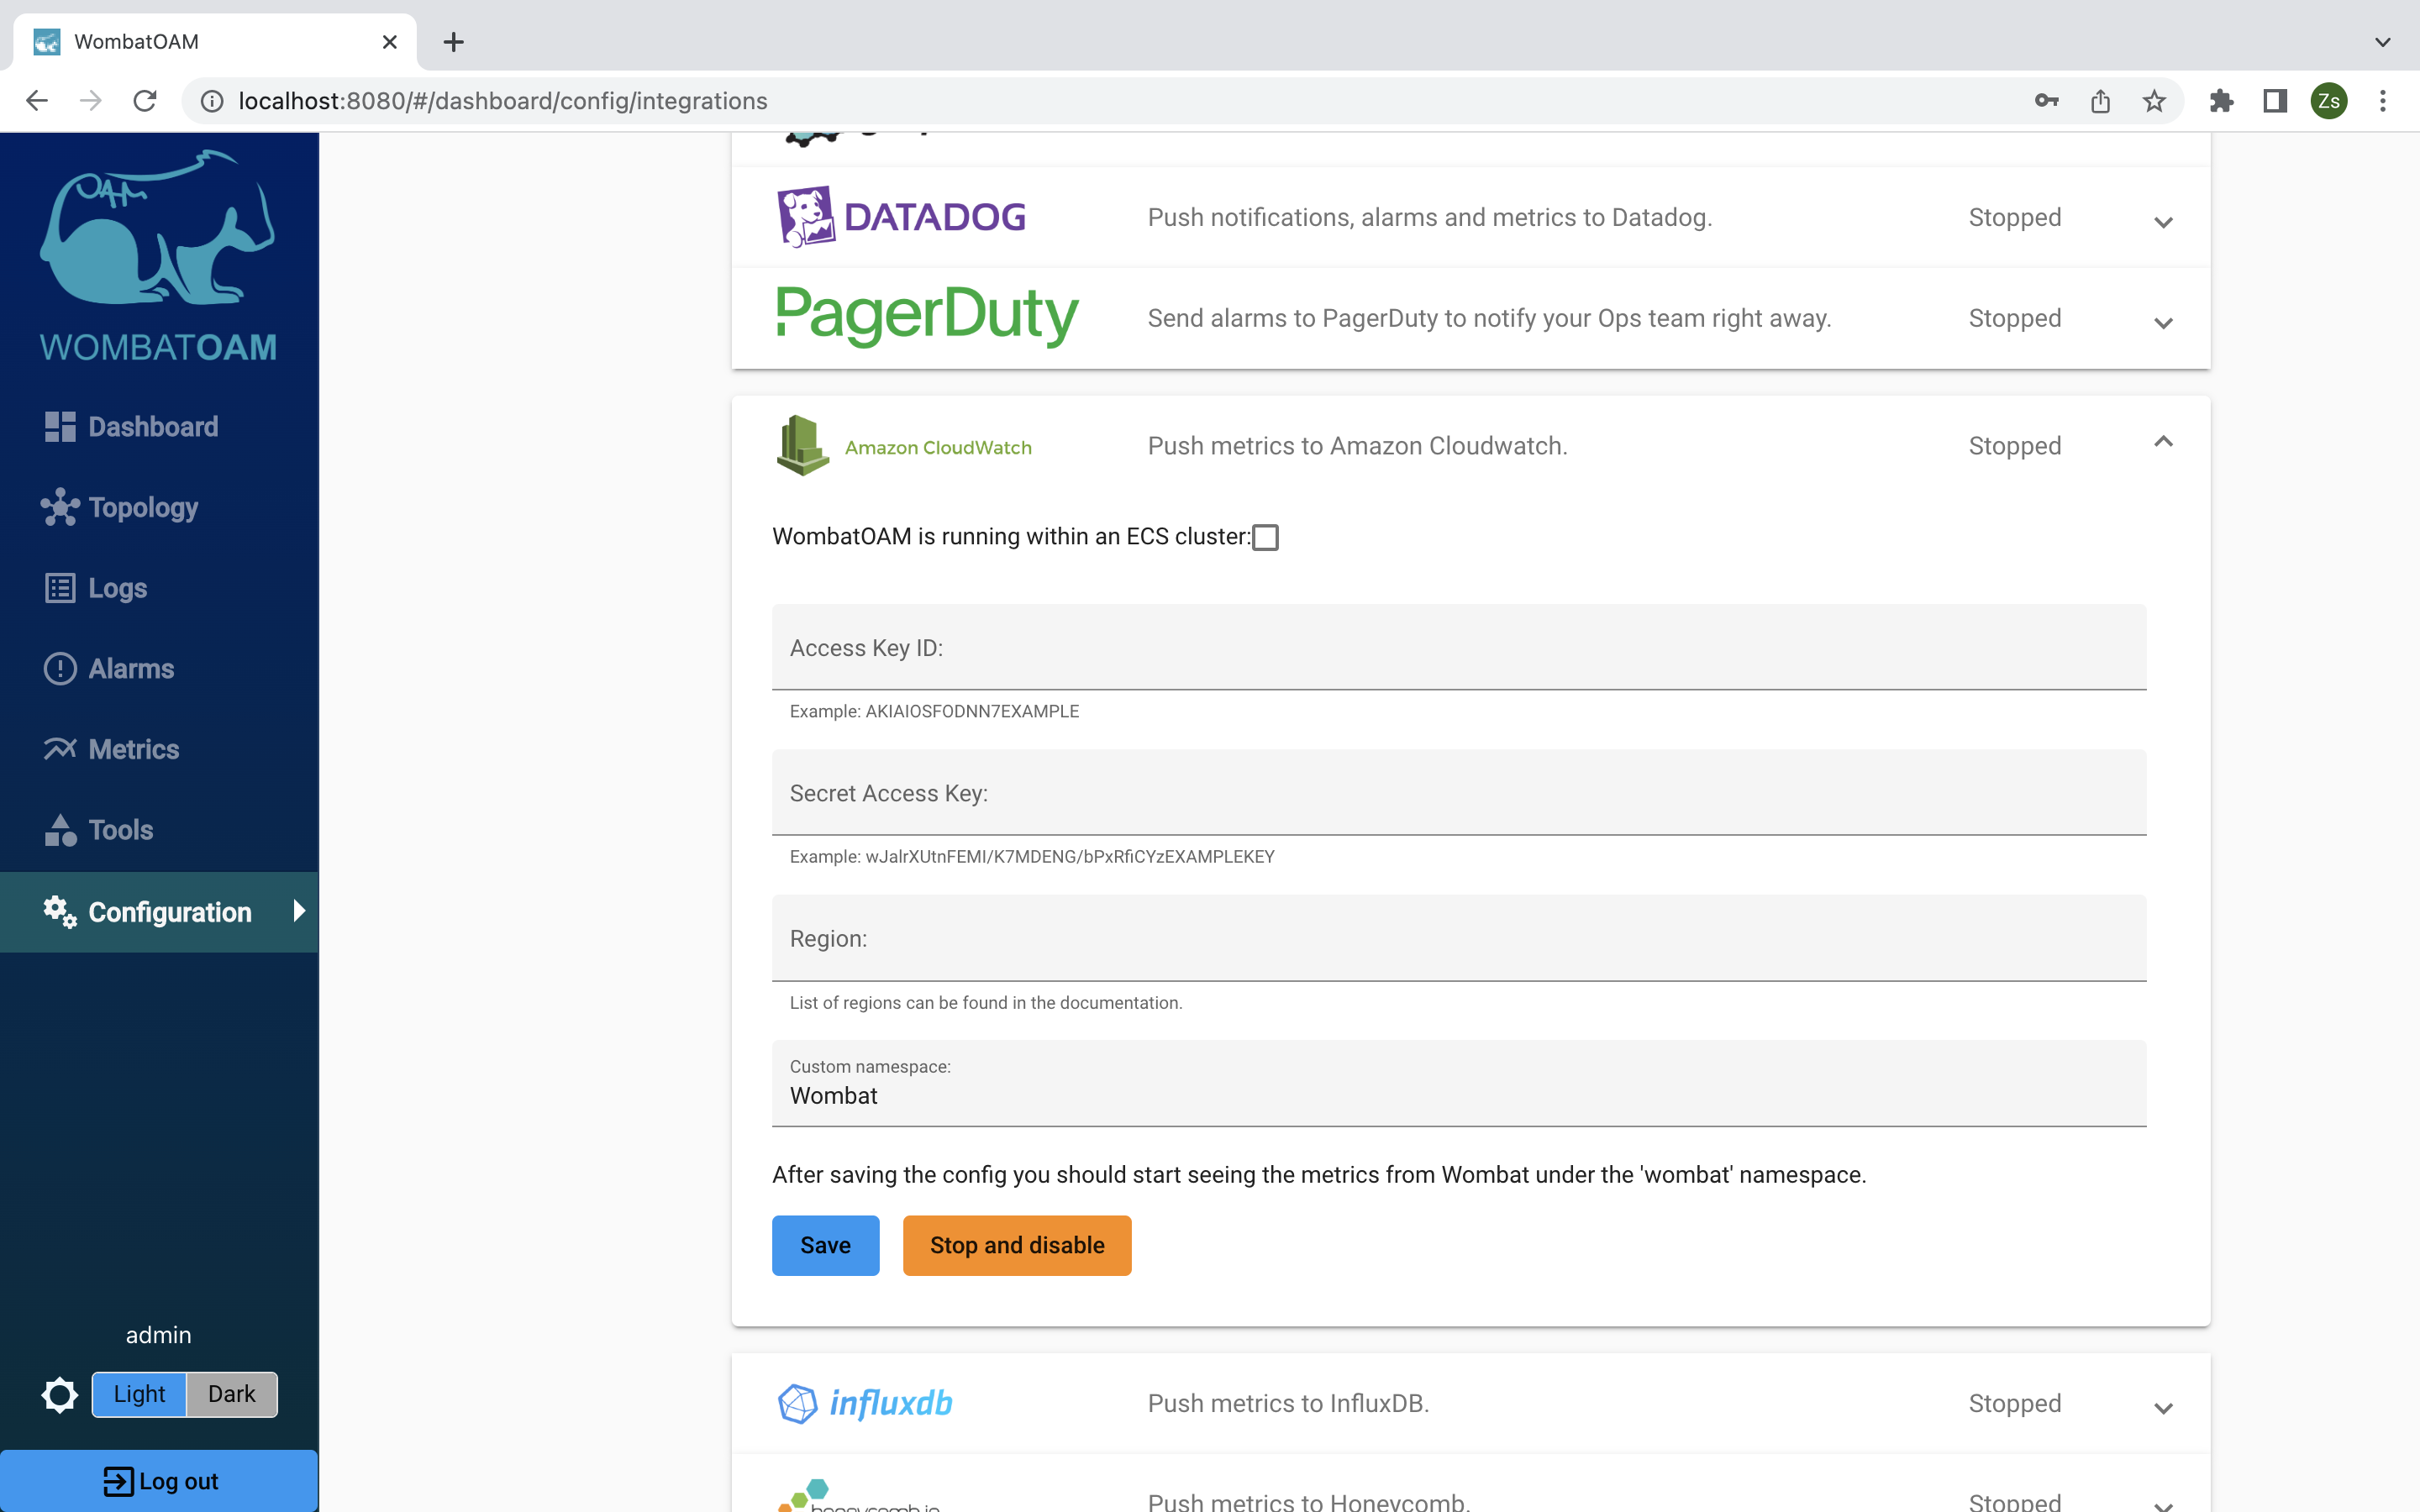
First method
- WombatOAM is running within an ECS cluster: By enabling this option it results in most of the textboxes are become disabled. This option uses an environmental variable, called
AWS_CONTAINER_CREDENTIALS_RELATIVE_URI, to generate the necessary credentials. WombatOAM has to be started in the ECS container because the environment variable gets defined inside the container during the setup procedure.
Second Method
By using this method three parameters needed for the credentials to be generated. These parameters are the Access Key, Secret Access Key and the Region.
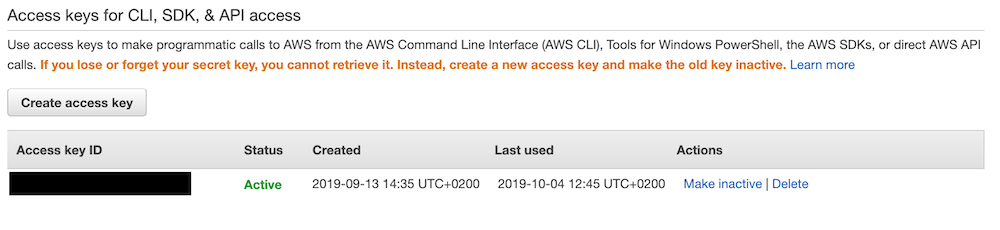
* Access Key ID: It can be found, if there is one already, or can be created under the My Security Credentials submenu. Accessable by clicking on the signed in user's name dropdown menu. Leran more.
- Secret Access Key: When creating a new Access Key ID the Security Access Key is created simultaneously. Be aware that it can be seen only once and cannot be accessed later. Leran more.
- Region: It is essential to let WombatOAM know where to send the metrics. List of Regions with their Region Names:
- us-east-2: US East (Ohio)
- us-east-1: US East (N. Virginia)
- us-west-1: US West (N. California)
- us-west-2: US West (Oregon)
- ap-east-1: Asia Pacific (Hong Kong)
- ap-south-1: Asia Pacific (Mumbai)
- ap-northeast-3: Asia Pacific (Osaka-Local)
- ap-northeast-2: Asia Pacific (Seoul)
- ap-southeast-1: Asia Pacific (Singapore)
- ap-southeast-2: Asia Pacific (Sydney)
- ap-northeast-1: Asia Pacific (Tokyo)
- ca-central-1: Canada (Central)
- cn-north-1: China (Beijing)
- cn-northwest-1: China (Ningxia)
- eu-central-1: EU (Frankfurt)
- eu-west-1: EU (Ireland)
- eu-west-2: EU (London)
- eu-west-3: EU (Paris)
- eu-north-1: EU (Stockholm)
- me-south-1: Middle East (Bahrain)
- sa-east-1: South America (Sao Paulo)
- us-gov-east-1: AWS GovCloud (US-East)
- us-gov-west-1: AWS GovCloud (US-West)
Read more about the regions here.
These parameters are important to generate a session token. While the token is valid the metrics can be sent from WombatOAM to Amazon Cloudwatch. There is no need the restart the integration after the token expires because the system automatically generates a new one if the previous one becomes unvalid.
Optional Parameter
- Custom Namespace: Providing a namespace is not crucial to start the integration, but it does stay available by
using any method. If it is empty the system uses the default custom namespace which is
Wombat. These namespaces must contain valid XML characters, and be fewer than 256 characters in length. Possible characters are: alphanumeric characters (0-9A-Za-z), period (.), hyphen (-), underscore (_), forward slash (/), hash (#), and colon (:). Leran more.
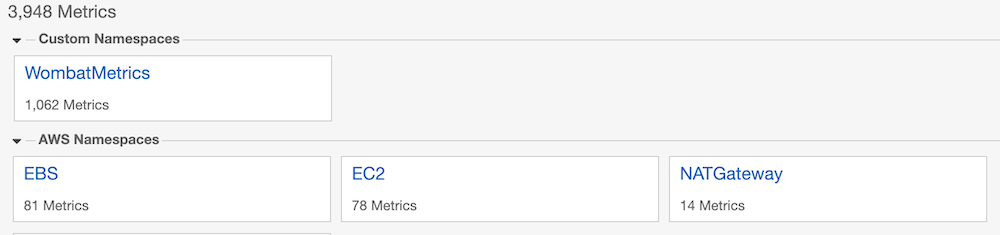
Once the configuration is completed the integration is ready to start. If a node is connected to WombatOAM,
its metrics are sent to the Amazon Cloudwatch service. The metrics can be found under the Metrics section in the
Custom Namespaces area under Wombat or under the provided custom namespace.
Integration with InfluxDB
InfluxDB is a time series database designed to handle high write and query loads. WombatOAM can send metrics via HTTP to InfluxDB v2.
Setup
Before starting the integration the following five parameters have to be added to WombatOAM:
- Host
- Port
- Token
- Organization
- Bucket
After typing in the parameters the integration validates all of them and responds with error messages if one or more of them are not added correctly.
Token
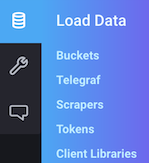
The token can be found through the GUI of InfluxDB or using influx CLI. In the navigation bar under the Load Data
menu there is a submenu called Tokens. Clicking on a user's token shows the token with the enabled authorizations.
Using the influx CLI executing the following shows the token. With option flags it is possible to filter the tokens.
1 | |
Organization and Bucket
Both values can be the names or the ids of the corresponding parameters. The integration validates the using API calls in the case of valid host and port. The parameters can found through API calls, GUI or influx CLI. The bucket can be retrived the same way as the organization. Read more at the InfluxDB documentation page.
- API
1 | |
1 | |
- influx CLI Executing the following commands shows the buckets and their ids. Using flags option can help filtering the results. The organization name or id has to be specified before executing the command.
1 | |
Executing the following commands shows the organizations and their ids. Using flags option can help filtering the results.
1 | |
- GUI
Buckets can be found under the
Load Datamenu, under theBucketssubmenu.
Furthermore in the address the id of the organization and the id of bucket is visible if a bucket is selected to edit its parameters. It follows the pattern that looks like this:
1 | |
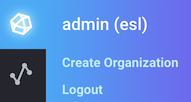
The current organozation can be found under the top menu right next to the user's name.
Starting the integration
After typing in the parameters click on the save button and if everything is valid the integration starts sending metrics to InfluxDB. Use the tags to narrow the set of metrics pushed to InfluxDB or use all to switch off filtering.
Integration with Webex Teams
WombatOAM can send alarm notifications to a specific webhook.
Setup webhook
To send alarm notifications to Webex Teams the following Webex application has to be connected
to the selected team. Press the connect button to for automatic setup.
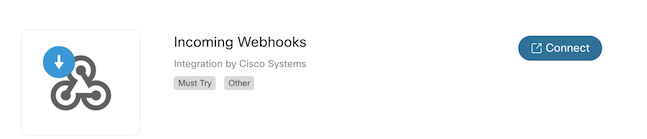
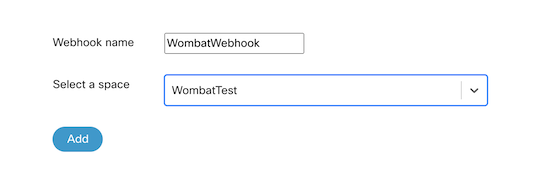
After that at the bottom of the page the webhook can be setup to the specific chatroom. Add a custom name for your webhook and select the space where the notifications could be sent.
The last step is to copy the URL of the hook and paste it into the URL field of the Webex Teams integration.
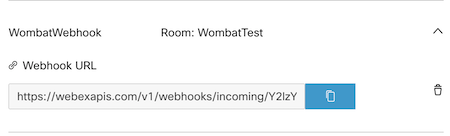
The result would look like this:
Configuration
Webex Teams integration can be configured through the GUI or through the configuration file. The format and the configuration is the same as for the Slack integration.
Setup through config file
Add the following entry to wombat.config:
1 2 3 | |
When an alarm is raised, Wombat sends a message with this format to Webex Teams:
1 2 3 4 5 6 7 8 9 10 11 12 13 14 15 16 17 18 | |
The format of the text and the fields are configurable.
An example:
1 2 3 4 5 6 7 8 9 10 11 12 13 14 15 16 17 18 | |
The color of the text messages are not supported in Webex Teams as a result all incoming notifications are going to appear in black and white.
Configuration options
The following configuration options are available:
webex_url: required The URL of the webhook, e.g. "https://webexapis.com/v1/webhooks/incoming/..."text_format: The format of the text message. The following variables are replaced in the actual text message by their values:$severity: The severity of the alarm (e.g.critical).$alarmid: The alarm ID of the alarm (e.g.disk_capacity_major).$nodename: The name of the node where the alarm was raised (e.g.'wo_test@127.0.0.1').$status: It israisedif the alarm is new orclearedif the alarm is cleared. The default is"[$severity] $nodename: $alarmid $status".send_alarms: A list of tags to narrow the set of alarms pushed to Slack or useallto switch off filtering. By default all alarms are pushed to Slack.fields: A list of fields that will be shown as attachment fields in the message, in the order of their appearance. Possible values:probable_cause: shows the Probable Cause of the alarm.proposed_action: shows the Proposed Repair Action of the alarm, or None if there's none.additional_information: shows any additional information, if present. The default is to show Probable Cause, Proposed Repair Action and Additional Information.