What is WombatOAM?
WombatOAM is an operations and maintenance tool for proprietary and open source Erlang and Elixir systems. All of the generic functionality to monitor and manage scalable, highly available systems, often only in part reimplemented from project to project, is now available in a battle-proven standalone solution. Using WombatOAM allows you to focus on your business logic, while reusing thousands of lines of code and tapping into decades of operational experience of Erlang-based systems.
WombatOAM's functionality is divided into two categories:
- WombatOAM Monitoring: Monitoring nodes, including collecting and displaying metrics, alarms and logs from the managed nodes. WombatOAM also contains tools that allow you to inspect and troubleshoot your system, as well as APIs that you can use to hook into your existing OAM and SAAS tools.
- WombatOAM Orchestration: Deploying nodes in the cloud or on specific proprietary clusters.
Orchestration is currently in Beta. We are looking for users interested in working with us while we bring it to R1.
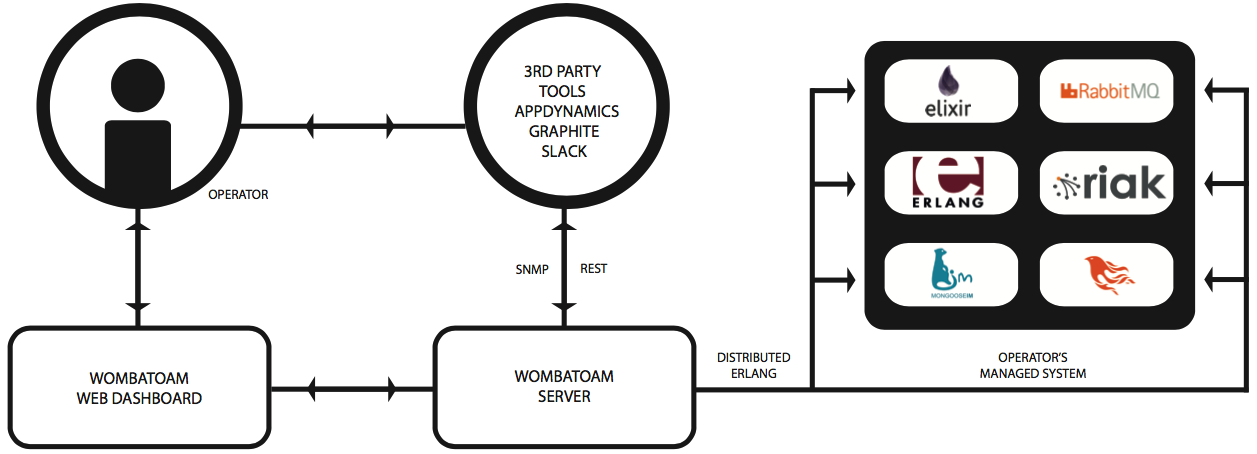
The WombatOAM server consists of one or more standalone nodes that connect to a system running on the Erlang VM using Distributed Erlang. The system consists of one or more Erlang VMs, possibly running different releases. The nodes in the system WombatOAM is connected to are called the managed nodes. They could be a proprietary application, or standalone open source applications such as CouchDB, Riak, RabbitMQ or Phoenix. Depending on the OTP applications that are running on the managed nodes, WombatOAM starts non-intrusive agents that enable it to monitor alarms and notifications, and collect information such as metrics and logs. This agent code is loaded on the fly, without having to include any proprietary WombatOAM applications in your release and without the nodes having to be restarted. WombatOAM will connect to them seamlessly – even if they have been running for years, or are running older versions of the Erlang VM.
The plugins used by WombatOAM have been optimized to reduce overheads caused by the agents monitoring the managed nodes. Overheads vary between 0.5%–1.5% of the total CPU cycles used by the Erlang VM, depending on how many applications you are monitoring and the underlying hardware, operating system, and possible virtualization layers. The performance of the business logic running in the managed nodes will barely be affected by the minimal overhead.
The WombatOAM web dashboard presents information to the operator in a manageable way. The dashboard is intended for use by DevOps teams when troubleshooting Erlang systems and for companies who have not integrated their Erlang systems to their existing OAM infrastructure. WombatOAM can also share this information with other third-party OAM tools, acting as a hub towards Nagios, Cacti, Graphite, Grafana or SAAS providers such as Splunk or PagerDuty (to mention just a few). As a result, it provides a single point of integration with the wider OAM infrastructure and SAAS providers without the need to upgrade and manipulate production code running in the managed nodes.
-
Autodiscovery of your node topology. Provide a node and its cookie, and WombatOAM will discover all existing nodes in your cluster, group them into releases (called node families), and start monitoring them. WombatOAM supports both long and short names, and can currently monitor the R14 Erlang runtime alongside later versions. Versions older than R14 can also be supported on demand.
-
Anomaly detection and early warnings, presented in the form of alarms and notifications. This allows DevOps teams to address and resolve problems before they escalate and cause service disruption. Integration has been made with the SASL alarm handler and the Elarm application, forwarding alarms specific to your system. SASL and Lager logs, including crash, warning and error reports, are also forwarded, giving you access to data specific to all your clusters in one place.
-
Automatic collection of more than a hundred built-in metrics from the Erlang runtime system, including different memory types, system limits, socket, port and process-specific metrics. Additional metrics retrieved from plugin modules of other supported OTP applications are also uploaded. Metrics from Folsom and Exometer are collected seamlessly if the managed nodes are using them to generate business metrics.
-
Application-specific plugins that run on the managed node and send metrics, notifications and alarms to WombatOAM. A set of built-in plugins covering many standard OTP applications and popular open source ones are shipped with WombatOAM. They can be turned on and off for each individual managed node. You can also implement proprietary plugins following a simple API.
-
Plugins have been implemented to monitor SASL, Lager, Folsom, Exometer, Elarm, Mnesia, OSmon and Cowboy OTP applications. For Riak, WombatOAM monitors Riak Core, key value (Bitcask and Active Anti-Entropy), replication services and Yokozuna. Many more plugins are being implemented, and you can write your own following a simple API.
-
Seamless integration with your OAM infrastructure by having existing integration plugins with Graphite, Grafana, Cacti, Graylog, Splunk, Zabbix, Datadog, Nagios, Logstash, AppDynamics and PagerDuty. If you are using proprietary OAM tools or SAAS providers currently not supported, the WombatOAM architecture provides flexibility to add integration points without the need to upgrade or restart your managed nodes. Integration happens in the WombatOAM node, reducing overhead in the managed nodes while reducing the risk of OAM-related issues escalating in the nodes managing the business logic.
-
A Web Dashboard and a REST interface, the former for interactive use if you need all of the information in one place, the latter to support automation and integration with your existing tool chain and scripts.
-
Visualization of the node topology and the ability to inspect specific node information, which facilitates troubleshooting. WombatOAM also acts as a point of integration of tools that allow closer inspection of what is happening in the managed nodes and facilitate troubleshooting, without the need to access the Erlang nodes and shell.
-
The dashboard can plot both historic and live metrics, showing you memory usage in real time, or helping you detect spikes no one would have noticed otherwise. Multiple metrics can be shown on the same graph for comparison purposes. Besides numeric metrics such as counters and gauges, WombatOAM also supports meters, spirals and histograms.
-
Deployment of Erlang nodes in heterogeneous clouds or on specified machines that scale to tens of thousands of nodes with no single point of failure. WombatOAM orchestration and monitoring has been tested on a cluster of 10,000 Erlang VMs, but is linearly scalable beyond that.