phoenix_graphql_plugin
phoenix plugin
Description
The phoenix graphql plugin reports metrics from requests performed to the endpoints
defined in the phoenix application. The plugin exposes fine-grain metrics to
give insight into your Phoenix LiveView callback requests. The plugin captures the number of
requests and the average response time for each registered callback and live component event.
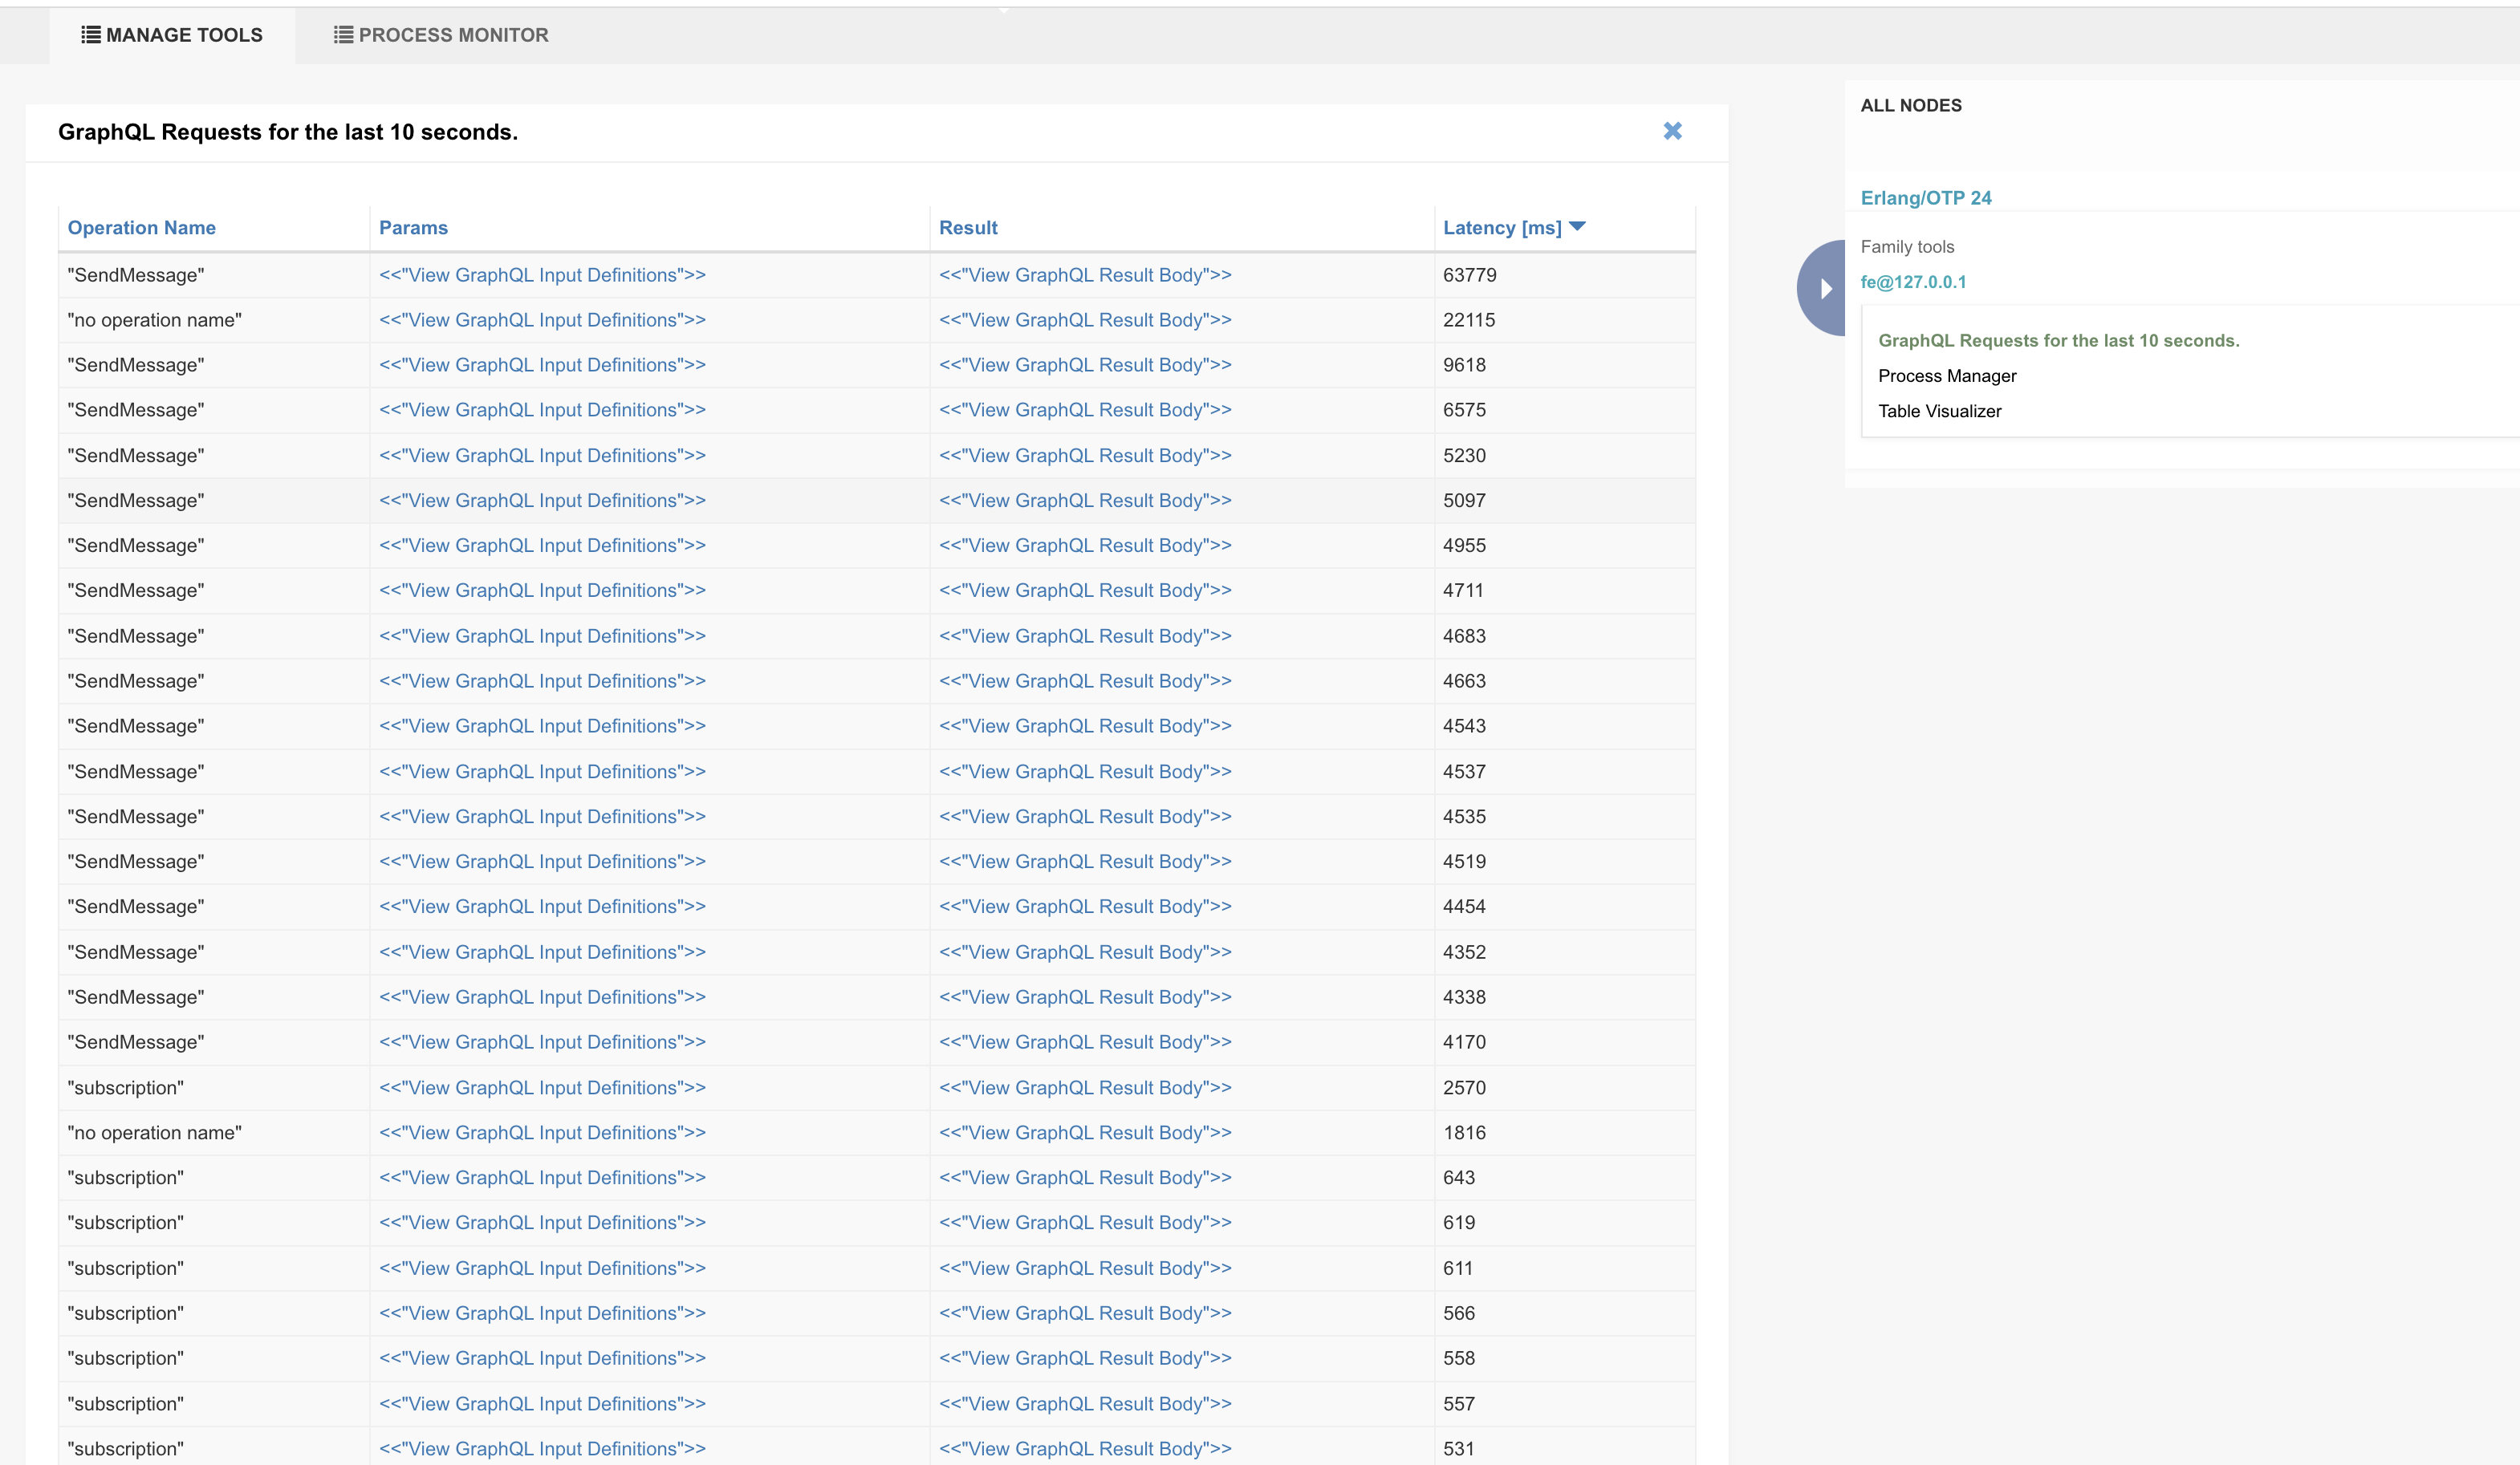
The phoenix_graphql_requests plugin is reporting top 30 requests endpoints with
a detailed insight into callback parameters. Callback requests will be displayed by Latency, from
high to low.
Applications it depends on
phoenix and telemetry
The plugin only works with Phoenix versions 1.4.x.
Modules
wombat_plugin_phoenix_graphql_requests
wombat_plugin_absinthe_requests_metrics
Reports
Metrics reported
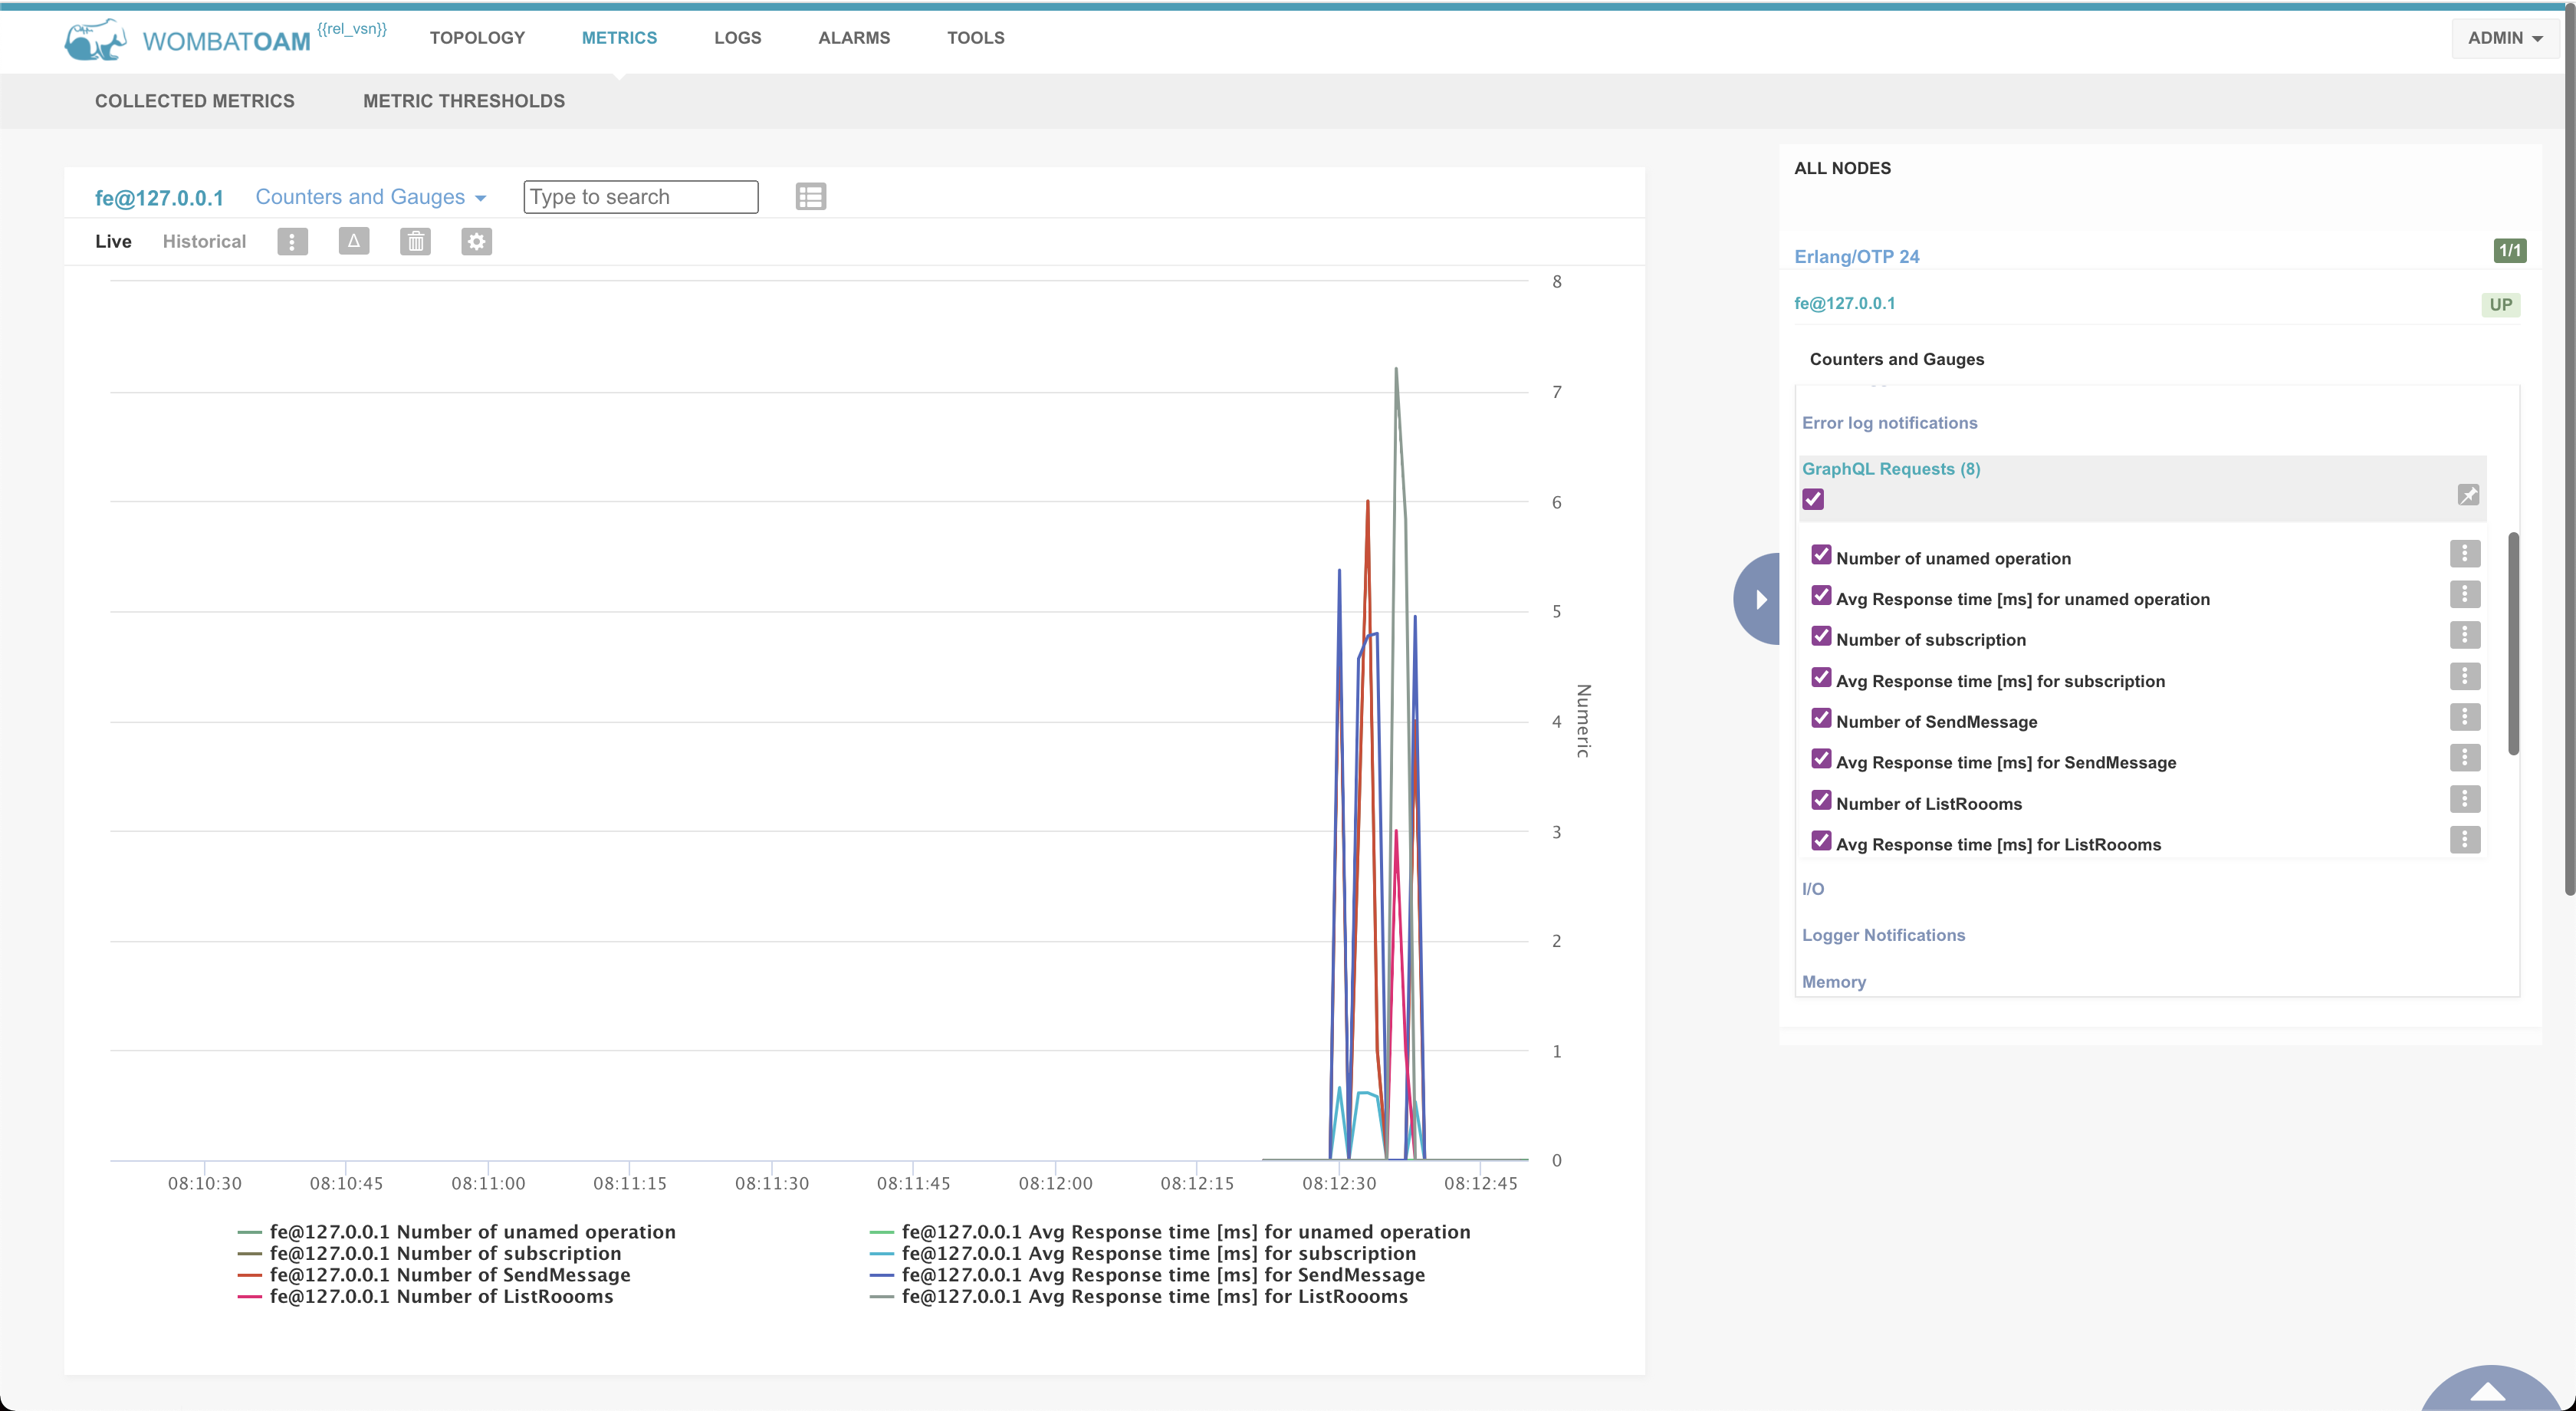
Graphql Events category: these metrics show the number of all callback requests and requests performed
Graphql RequestNumber and Avrage Letency Number Tags:dev,op.
Graphql Requests Table category: shows top 30 callback requests.
Operation NameGraphql Operation name, e.g query, mutation,no_operation_namewill be displayed if operation names are unnamedParamsgives you a insight overview of the parameters which are being sent to the serverResultserver responseLatency- request latency in millisecond